
Bitcoin price fell below $110,000 as increased exchange-traded fund (ETF) outflows and renewed selling pressure pulled the market deeper into correction territory.
summary
- Spot ETFs saw outflows of $536 million, sending Bitcoin below $110,000.
- Derivatives data shows heightened caution, with volumes up 40% but open interest flat.
- Analysts warn that if support at $108,000 is not maintained, a fall towards $100,000 is possible.
Bitcoin fell on October 17th, falling below the $110,000 milestone and reaching $108,420 at the time of writing, down 2.4% in the past 24 hours. The cryptocurrency is down 10% over the past week, 7% in the past month, and is currently 14% below its all-time high of $126,080.
Trading activity increased during the downturn. Bitcoin (BTC) 24-hour trading volume rose 25% to $83.1 billion, marking further movement as traders adjusted around key support zones.
Bitcoin futures trading volume rose 40% to $127.6 billion, while open interest remained essentially unchanged at $72.8 billion, according to data from CoinGlass. This indicates that traders are being aggressive but cautious, adjusting their positions rather than making new strong bets.
Spot BTC ETF Outlook
The US Spot Bitcoin ETF recorded $536.4 million in outflows on October 16, the second day of withdrawals, according to SoSoValue data. ARK Invest’s ARKB topped the list with $275 million in redemptions, followed by Fidelity’s FBTC with $132 million. Grayscale’s GBTC, BlackRock’s IBIT and Bitwise’s BITB also recorded smaller losses.
These continued outflows suggest that some financial institutions are reducing their exposure or locking in profits following Bitcoin’s recent surge. Increased redemptions in ETFs often add short-term selling pressure, especially when market sentiment is uncertain.
Technical analysis of Bitcoin price
Bitcoin’s short-term technical setup is fragile. The Relative Strength Index of 37 suggests neutral to weak momentum, but the momentum indicates a mild buy signal, indicating that downside pressure may be slowing.
However, all major moving averages from the 200-day SMA ($107,535) to the 10-day EMA ($112,885) are showing sell signals, indicating a sustained bearish bias.
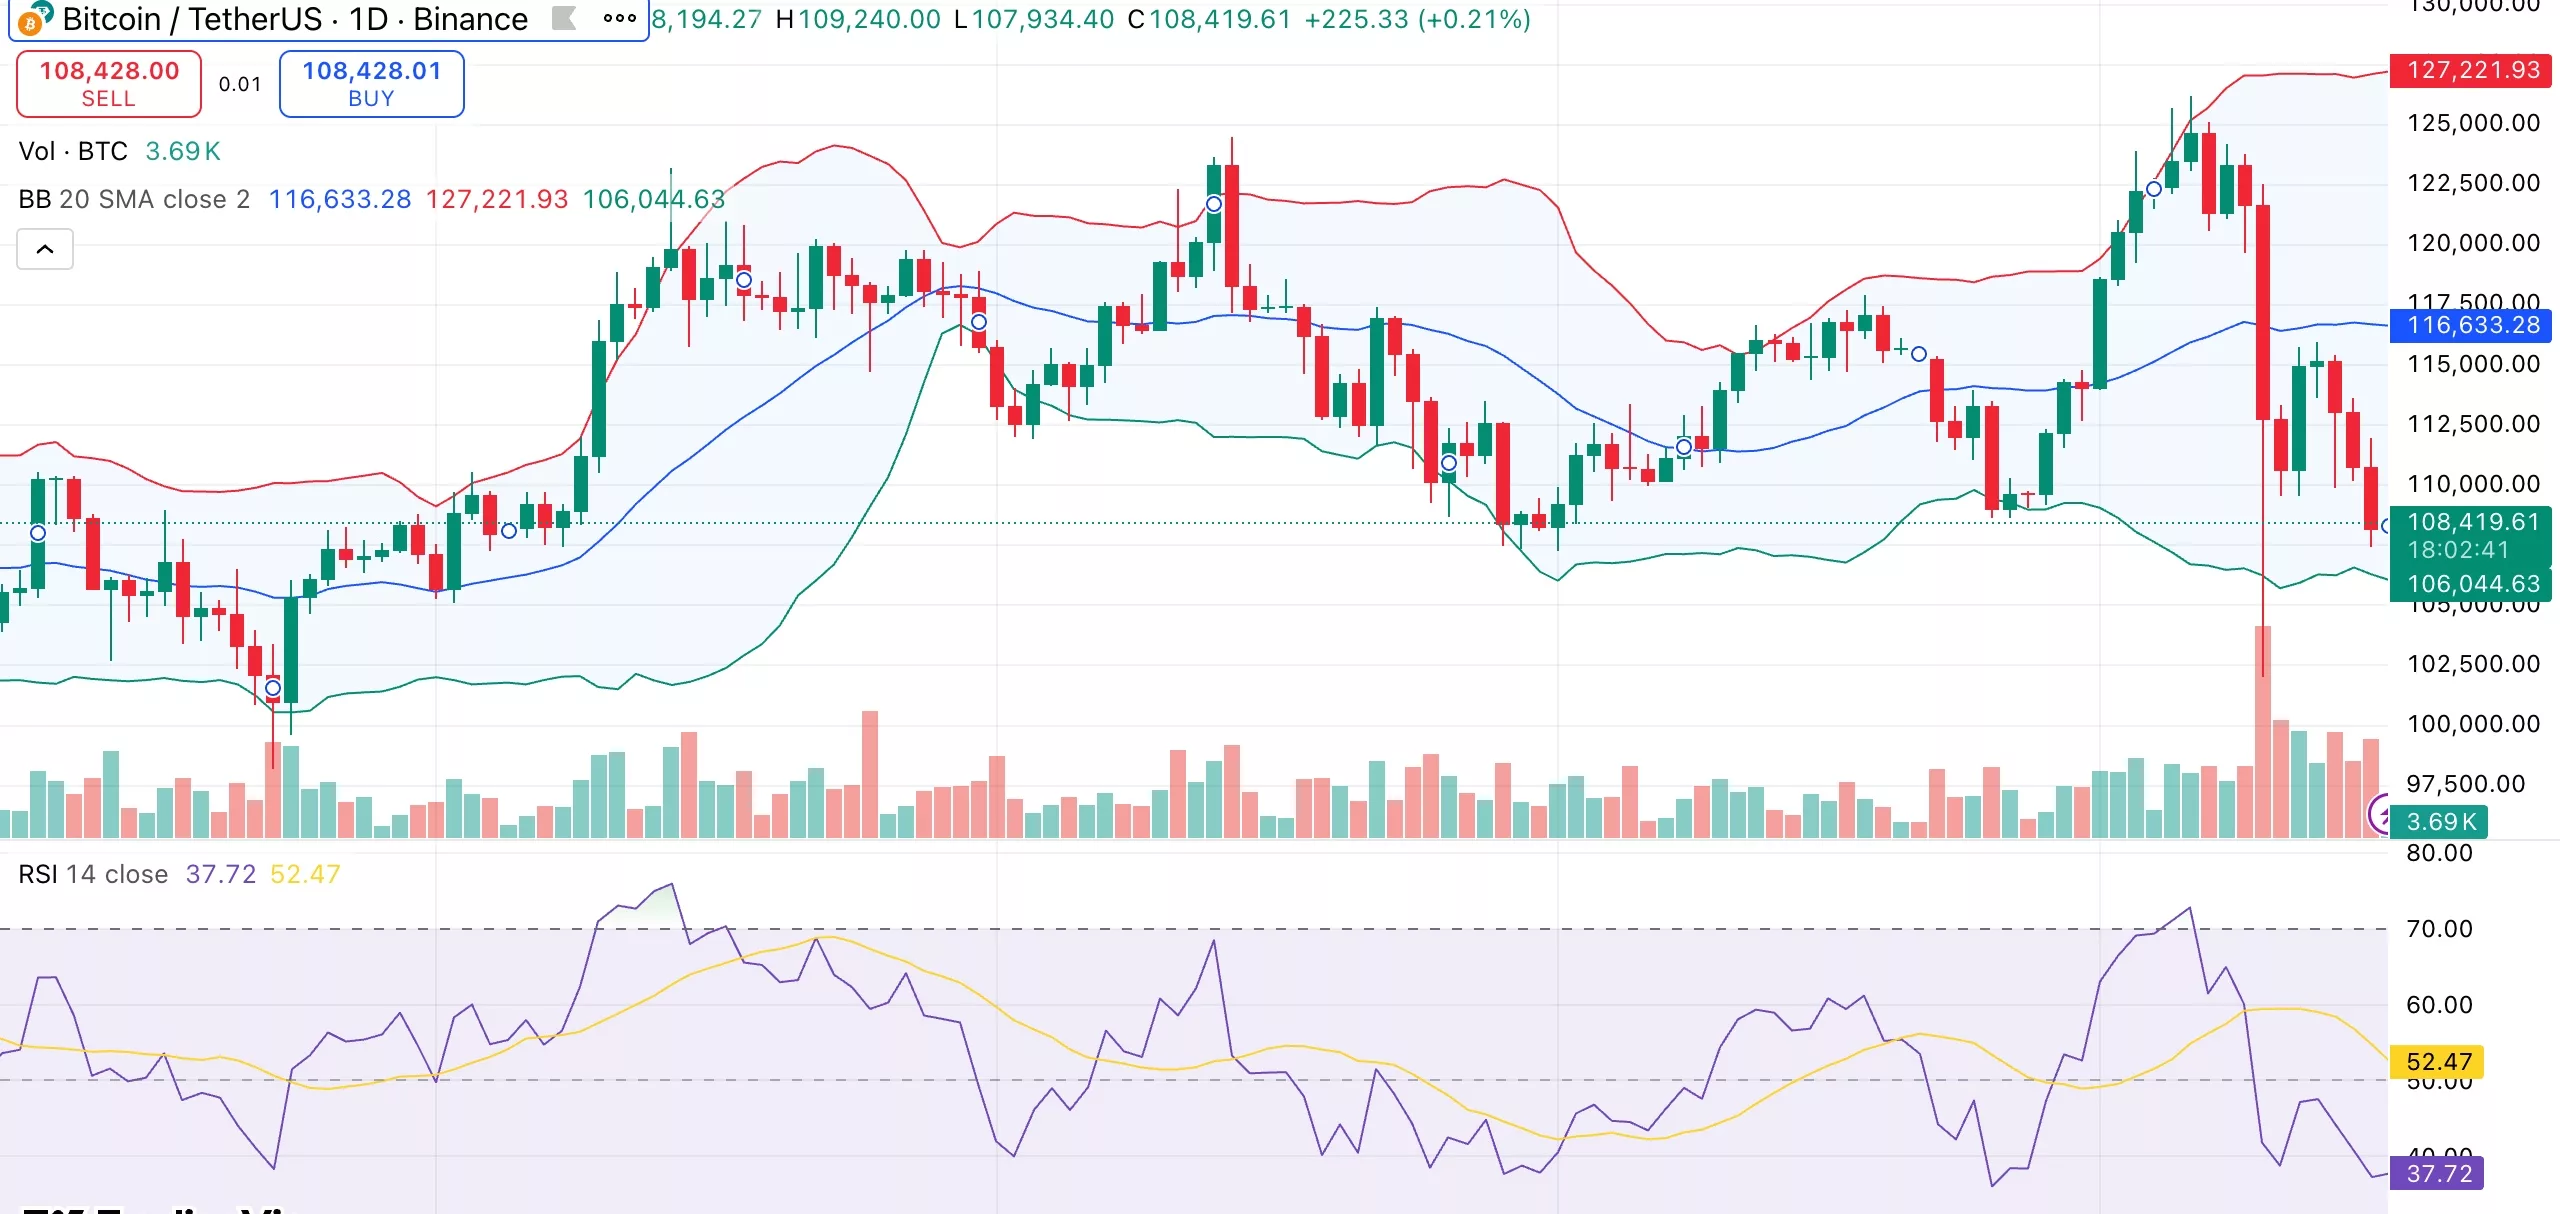
Bitcoin daily chart. Credit: crypto.news
Bitcoin is hovering at the lower end of the Bollinger Bands and volatility is rising, which could signal further movement if support breaks. The $108,000 to $109,000 range has emerged as an important level to monitor.
If Bitcoin stays at this level in the near future, it could rally towards the $113,000 to $115,000 zone. A break below this level could lead to a rally towards $104,000, but could also increase interest from new buyers.
Some analysts, such as Arthur Hayes, believe the stock could rise closer to $100,000 if the sell-off continues. Some believe prices will stabilize soon, citing continued steady demand from long-term holders and ETFs.
read more: Ark Invest files for new Bitcoin ETF with lower yield and risk