
Ethereum price is trading within an ascending wedge at $3,200, and the bearish pattern indicates that momentum is weakening and a breakdown towards the lower support area is becoming more likely.
summary
- ETH forms a bearish rising wedge as price approaches the $3,200 area.
- Loss of Value Area High and low volumes indicate structural weaknesses.
- A breakdown below the wedge and POC could accelerate the move towards the $2,500 support.
Ethereum (ETH) price has slowly recovered from its recent lows, but there are flashing warning signs in the structure of this pullback. The asset is rebounding into a bearish rising wedge, a technical formation that often appears during corrective moves in broad downtrends.
A continuation of the downside is increasingly likely as volume fails to support the recent rally and key market profile levels remain under pressure. With ETH trading near $3,200, traders are closely monitoring structural signals that could point to further declines in the near term.
Important technical points of Ethereum price
- Ethereum has formed a bearish ascending wedge, a continuation pattern that favors a downside resolution.
- The decline in the highs in the value area led to new lows, indicating structural weakness.
- A break below the top of the wedge and the point of control could accelerate the move towards the $2,500 support.
You may also like: HyperLiquid Strategies plans $30 million in share buybacks to increase HYPE-related stock purchases
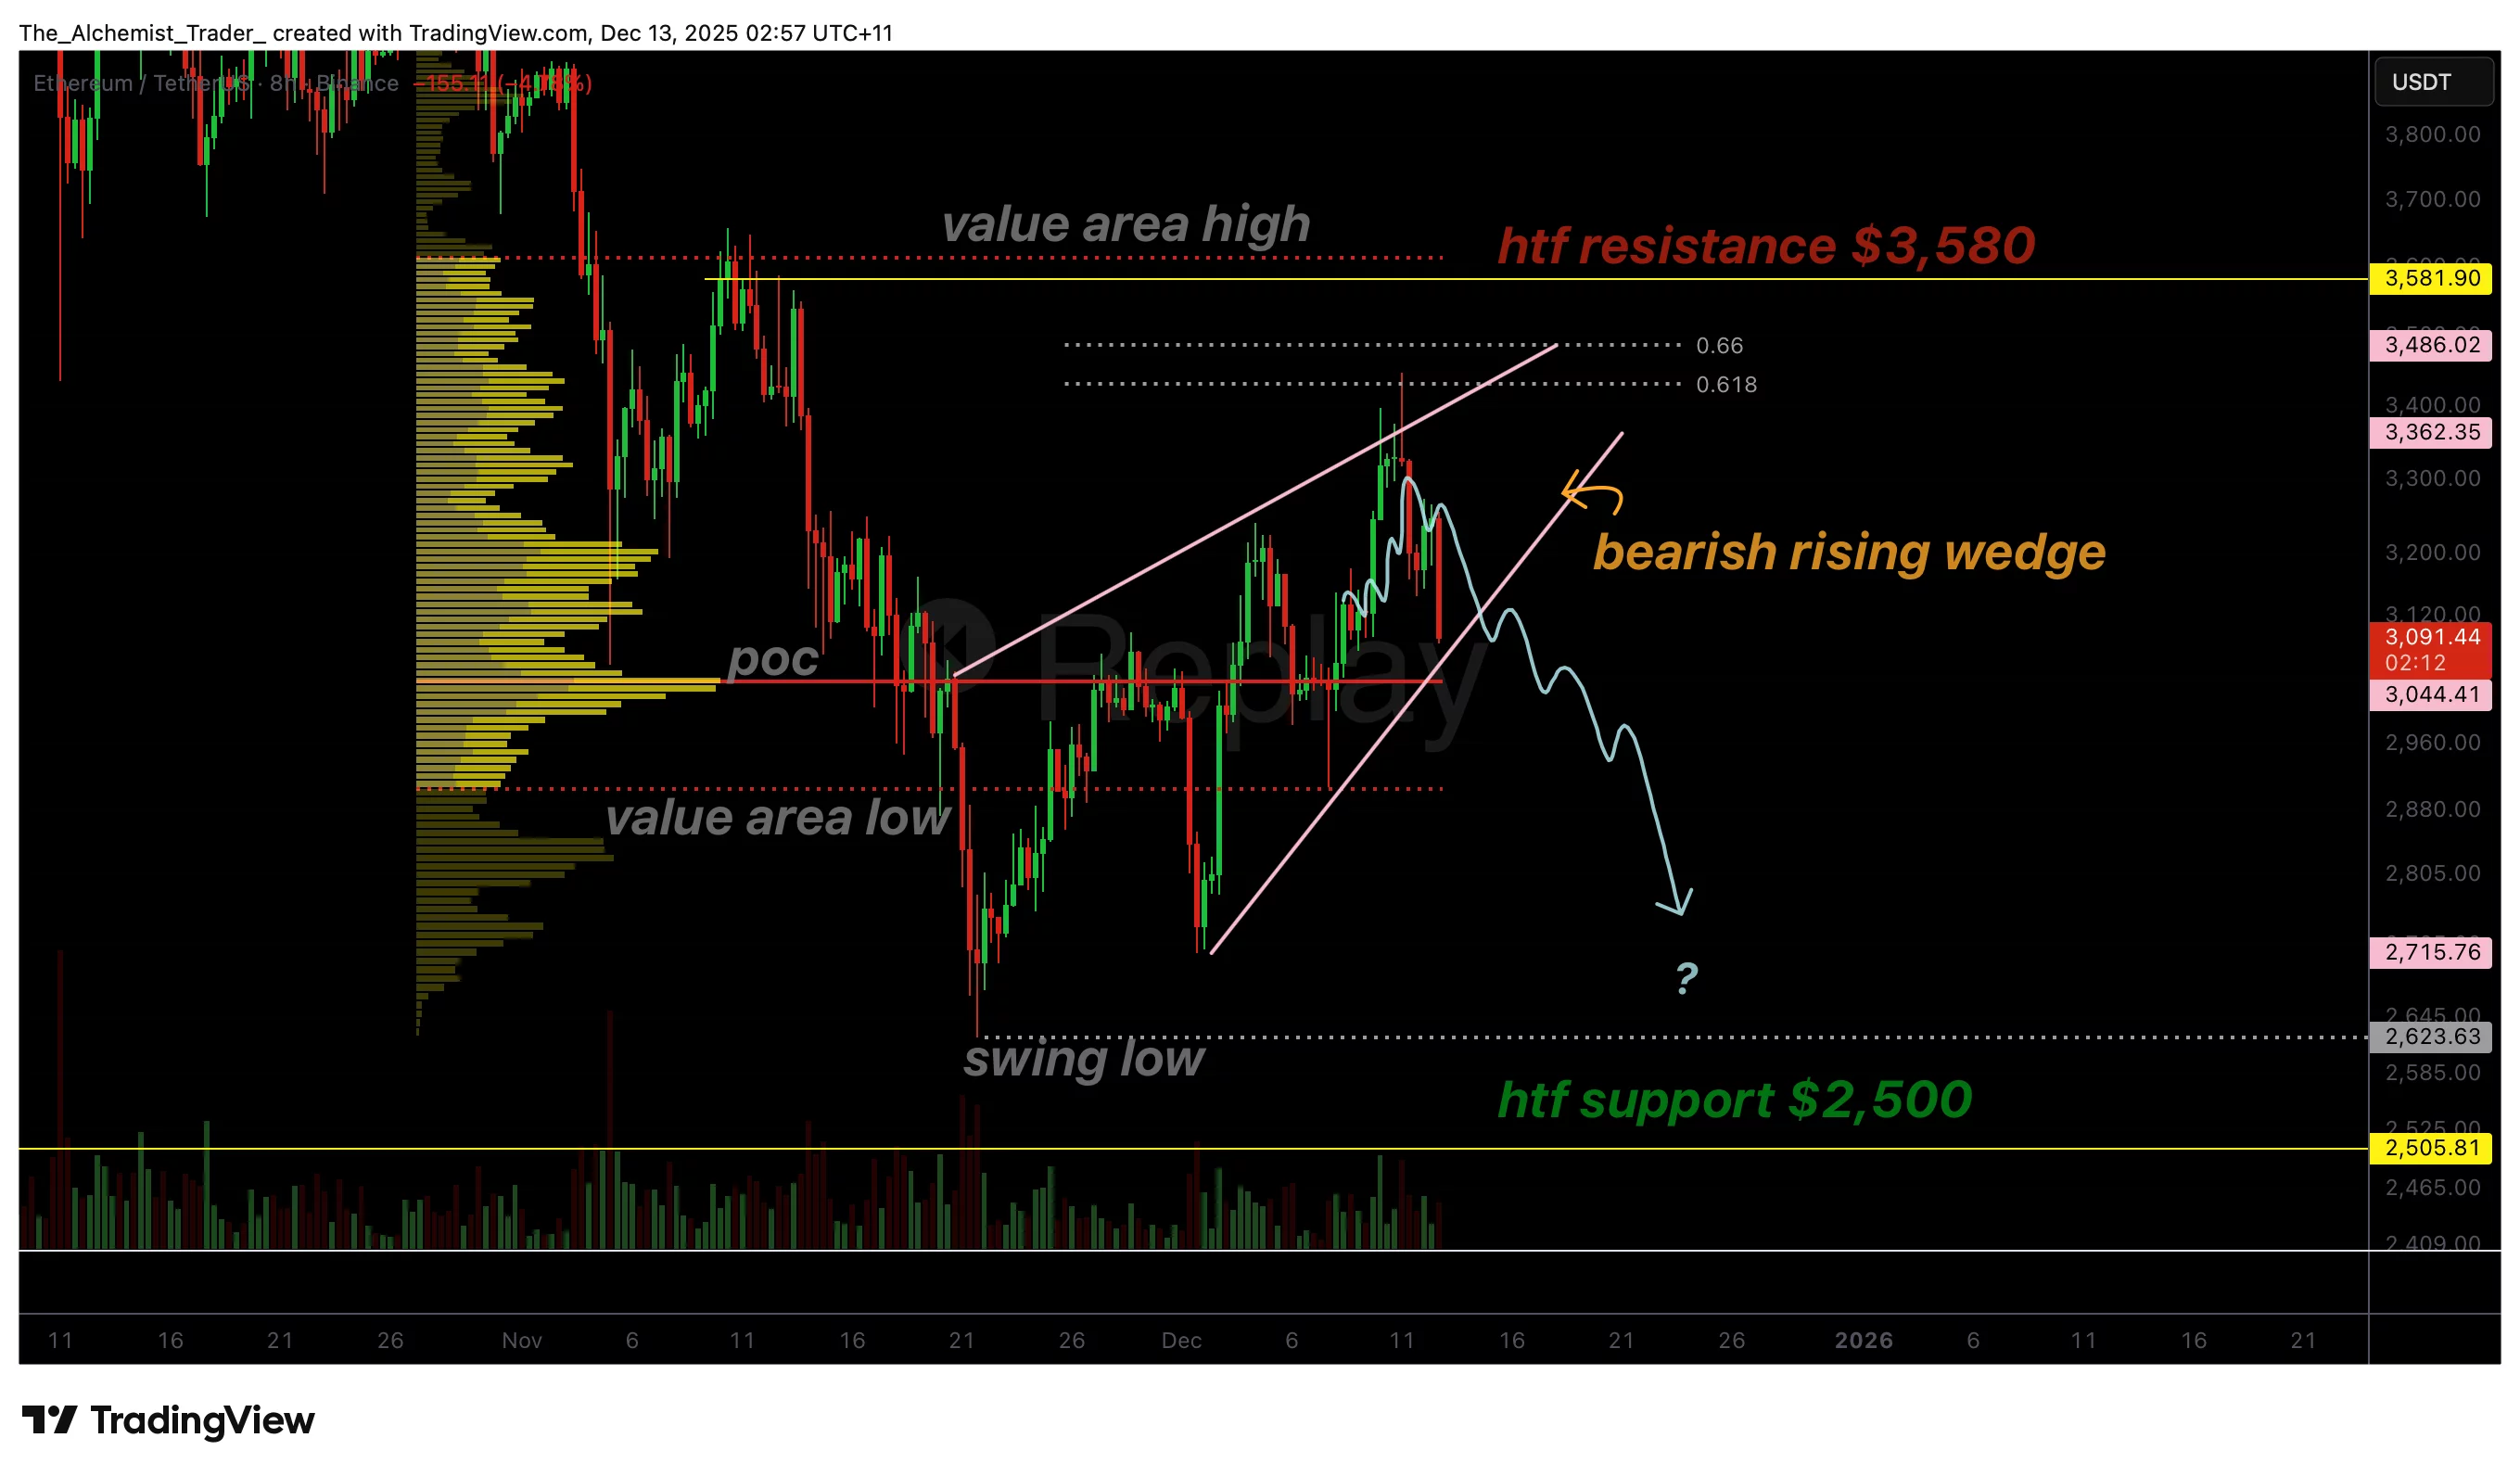
ETHUSDT (8H) chart, source: TradingView
Ethereum recently rose to around $3,200, but the structure of this move is not favorable. The current formation, known as a bearish rising wedge, typically occurs during a retracement phase within a broader downtrend.
Despite widespread sentiment being affected by developments such as WisdomTree’s debut of Europe’s first Lido Stake Ethereum ETP, which has not translated into meaningful bullish momentum on the charts, it has been characterized by price increases amid weakening momentum, often leading to sharp declines when the support below the wedge breaks.
This is consistent with the broader situation. ETH lost its value area high (VAH) earlier in the week, resulting in a complete decline to establish a new swing low. The rebound from this level has pushed prices higher, but the rally itself lacks meaningful bullish volume, suggesting that buyers are not actively intervening. If prices rise without volume increasing, it reflects absorption rather than strong demand and is an early sign that the movement may not be sustainable.
The wedge itself contains an apex zone where the pattern is expected to resolve. This apex roughly coincides with the 0.618 Fibonacci retracement, a level where price typically stalls or reverses on a correctional pullback. Compounding this setup is the presence of dynamic support below the price. When this support converges to the top, the range narrows and usually leads to a definitive breakout, which in a bearish rising wedge scenario almost always leads to a downside.
You may also like: XRP ETF Attracts Nearly $1 Billion in Capital Inflows: How to Capture Crypto Market Opportunities with Investor Hash
An important level to keep an eye on is the Point of Control (POC) within the current trading range. If Ethereum breaks down from the wedge and loses POC, price movements could rapidly accelerate as liquidity thins below this level. When a POC is lost, the strongest volume node within the range is removed, often resulting in sharp, directional movements as the market looks for the next area of interest.
In the case of Ethereum, the next major level is at the $2,500 support zone, which is a technical area on the higher timeframe that has historically served as an important pivot. If ETH loses wedge support and falls below POC, the most likely scenario is a rotational move towards $2,500. This is consistent with Ethereum’s macro market structure, which remains bearish with consecutive highs and lows.
What to expect from future price trends
Ethereum is nearing a critical tipping point. A breakdown from the ascending wedge, especially if accompanied by a POC loss, could send the price towards the $2,500 support area. Unless the bulls regain volume and break the wedge to the upside, a continued downside remains the dominant scenario.
read more: HBAR price shakes from support at $0.12, showing early signs of collapse