
Ethereum continues to show steady resilience on the 4-hour chart as buyers defend the higher price zone. The asset is trading around $3,250 after rebounding sharply from late November lows around $2,625. Importantly, the price movement is outpacing the short-term average increase, reinforcing the constructive trend structure.
In addition to regaining momentum, Ethereum is currently approaching a key technical level that could define its next directional move. Market participants are closely monitoring whether the bullish pressure persists as the price tests the overhead resistance zone.
Ethereum 4H trend structure signal suppresses upside
Ethereum has maintained a series of distinct lows, confirming a sustained short-term uptrend. Additionally, the price has regained its 20, 50, and 100 period exponential moving averages, which are now acting as dynamic support. This change suggests that buyers are maintaining control during the pullback.
However, price is approaching the Fibonacci resistance cluster that historically attracts supply. As a result, short-term consolidation may occur before continuation. Still, the trend structure remains intact as long as ETH remains above the $3,120 area.
ETH price dynamics (Source: Trading View)
The main resistance level lies between $3,280 and $3,300, which was previously aggressively defended by sellers. Furthermore, a break above this zone could pave the way to $3,440 along the 0.5 Fibonacci retracement.
Related: Shiba Inu price prediction: Shiba Inu price stalls as technological pressures counteract ecosystem…
Beyond that, the $3,630 level represents an important continuation threshold. Therefore, a decisive breakout could accelerate the upward momentum towards the $3,900 area.
Futures open interest reflects increased market commitment
Ethereum futures data shows a steady increase in open interest, highlighting growing participation in derivatives. Open interest increased consistently throughout 2024 and accelerated during the recent rally. Importantly, levels remain elevated during the correction phase.
This behavior suggests that traders are maintaining exposure rather than actively exiting positions. Additionally, the latest reading of nearly $41 billion reflects strong speculative involvement as ETH trades above key psychological levels. As a result, price reactions near support or resistance can become sharper as leverage increases.
Spot flows indicate tight exchange supply
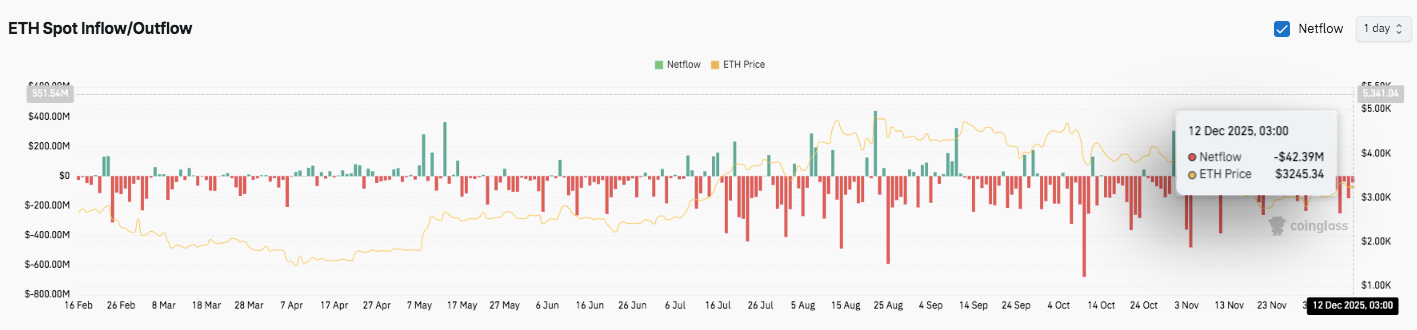
Source: Coinglass
Spot exchange data shows continued net outflows, suggesting a decline in selling pressure. Recent sessions have been dominated by red outflow bars, indicating continued withdrawals to private wallets.
Additionally, inflows appear to be small and infrequent, suggesting limited distribution at current prices. In particular, the surge in outflows coincides with price stability, reinforcing a holding-driven market environment. According to the latest data, ETH is trading at around $3,245, while net outflows are around $43 million.
Technical outlook for Ethereum (ETH) price
Ethereum’s technical structure remains constructive as price remains above key short-term support levels. ETH continues to trade within the formation of highs and lows, reflecting stable demand after the rally in late November.
Related: Fundamental Featured Token Price Prediction: BAT Remains Bullish Structure As Traders Flock
The upside level remains well-defined, with $3,280-$3,300 serving as an immediate resistance zone. If a breakout above this range is confirmed, it could open the door to $3,440 and then $3,630, which matches the 0.618 Fibonacci retracement. Beyond that, $3,905 becomes a major barrier to upside.
On the downside, supported by the rising EMA, $3,150-$3,120 remains the first area buyers need to protect. Losing this zone could expose ETH to the psychological level of $3,000. Below that, $2,875 to $2,900 represents the previous range breakdown area, while $2,625 remains a broad trend invalidation level.
The technical situation suggests that Ethereum is consolidating under resistance rather than showing depletion. Compression near the upper bound often precedes an expansion in volatility. Therefore, directional confirmation will depend on how the price reacts around $3,300.
Will Ethereum rise further?
Ethereum’s near-term outlook depends on whether it can sustain above $3,120 while establishing acceptance near resistance. Strong participation in derivatives and sustained spot outflows confirm tight supply. As a result, a clean break above $3,300 could continue towards higher Fibonacci targets.
However, failure to protect the EMA support could lead to a controlled decline towards $3,000 before renewed buying interest emerges. For now, Ethereum remains in a key inflection zone, where confirmation will shape its next big move.
Related: Bitcoin Price Prediction: Symmetrical Triangle Tight as Bulls Remain Alert After $77M ETF Outflow
Disclaimer: The information contained in this article is for informational and educational purposes only. This article does not constitute financial advice or advice of any kind. Coin Edition is not responsible for any losses incurred as a result of the use of the content, products, or services mentioned. We encourage our readers to do their due diligence before taking any action related to our company.