
Ethereum price trends are sending mixed signals. After a one-day correction of more than 3%, ETH is showing signs of an early rebound, but downside risks are not yet resolved. Chart structure, momentum data, and on-chain cost levels all point to a narrow decision zone.
Currently, Ethereum is caught between a potential bounce and an even deeper decline. And the difference between these two results is smaller than it seems. What is noteworthy is that the failure zone is approaching.
The rebound signal falls within a tight triangle.
Ethereum is trading in a shrinking triangle that reflects growing indecision among buyers and sellers. Prices are compressing towards the lower trend line, which is often the zone where selling pressure begins to weaken.
From December 1st to December 17th, ETH hit even higher lows. At the same time, the Relative Strength Index (RSI), a tool for measuring momentum, also hit new lows. This creates a hidden bullish divergence and means the selling momentum is weakening.
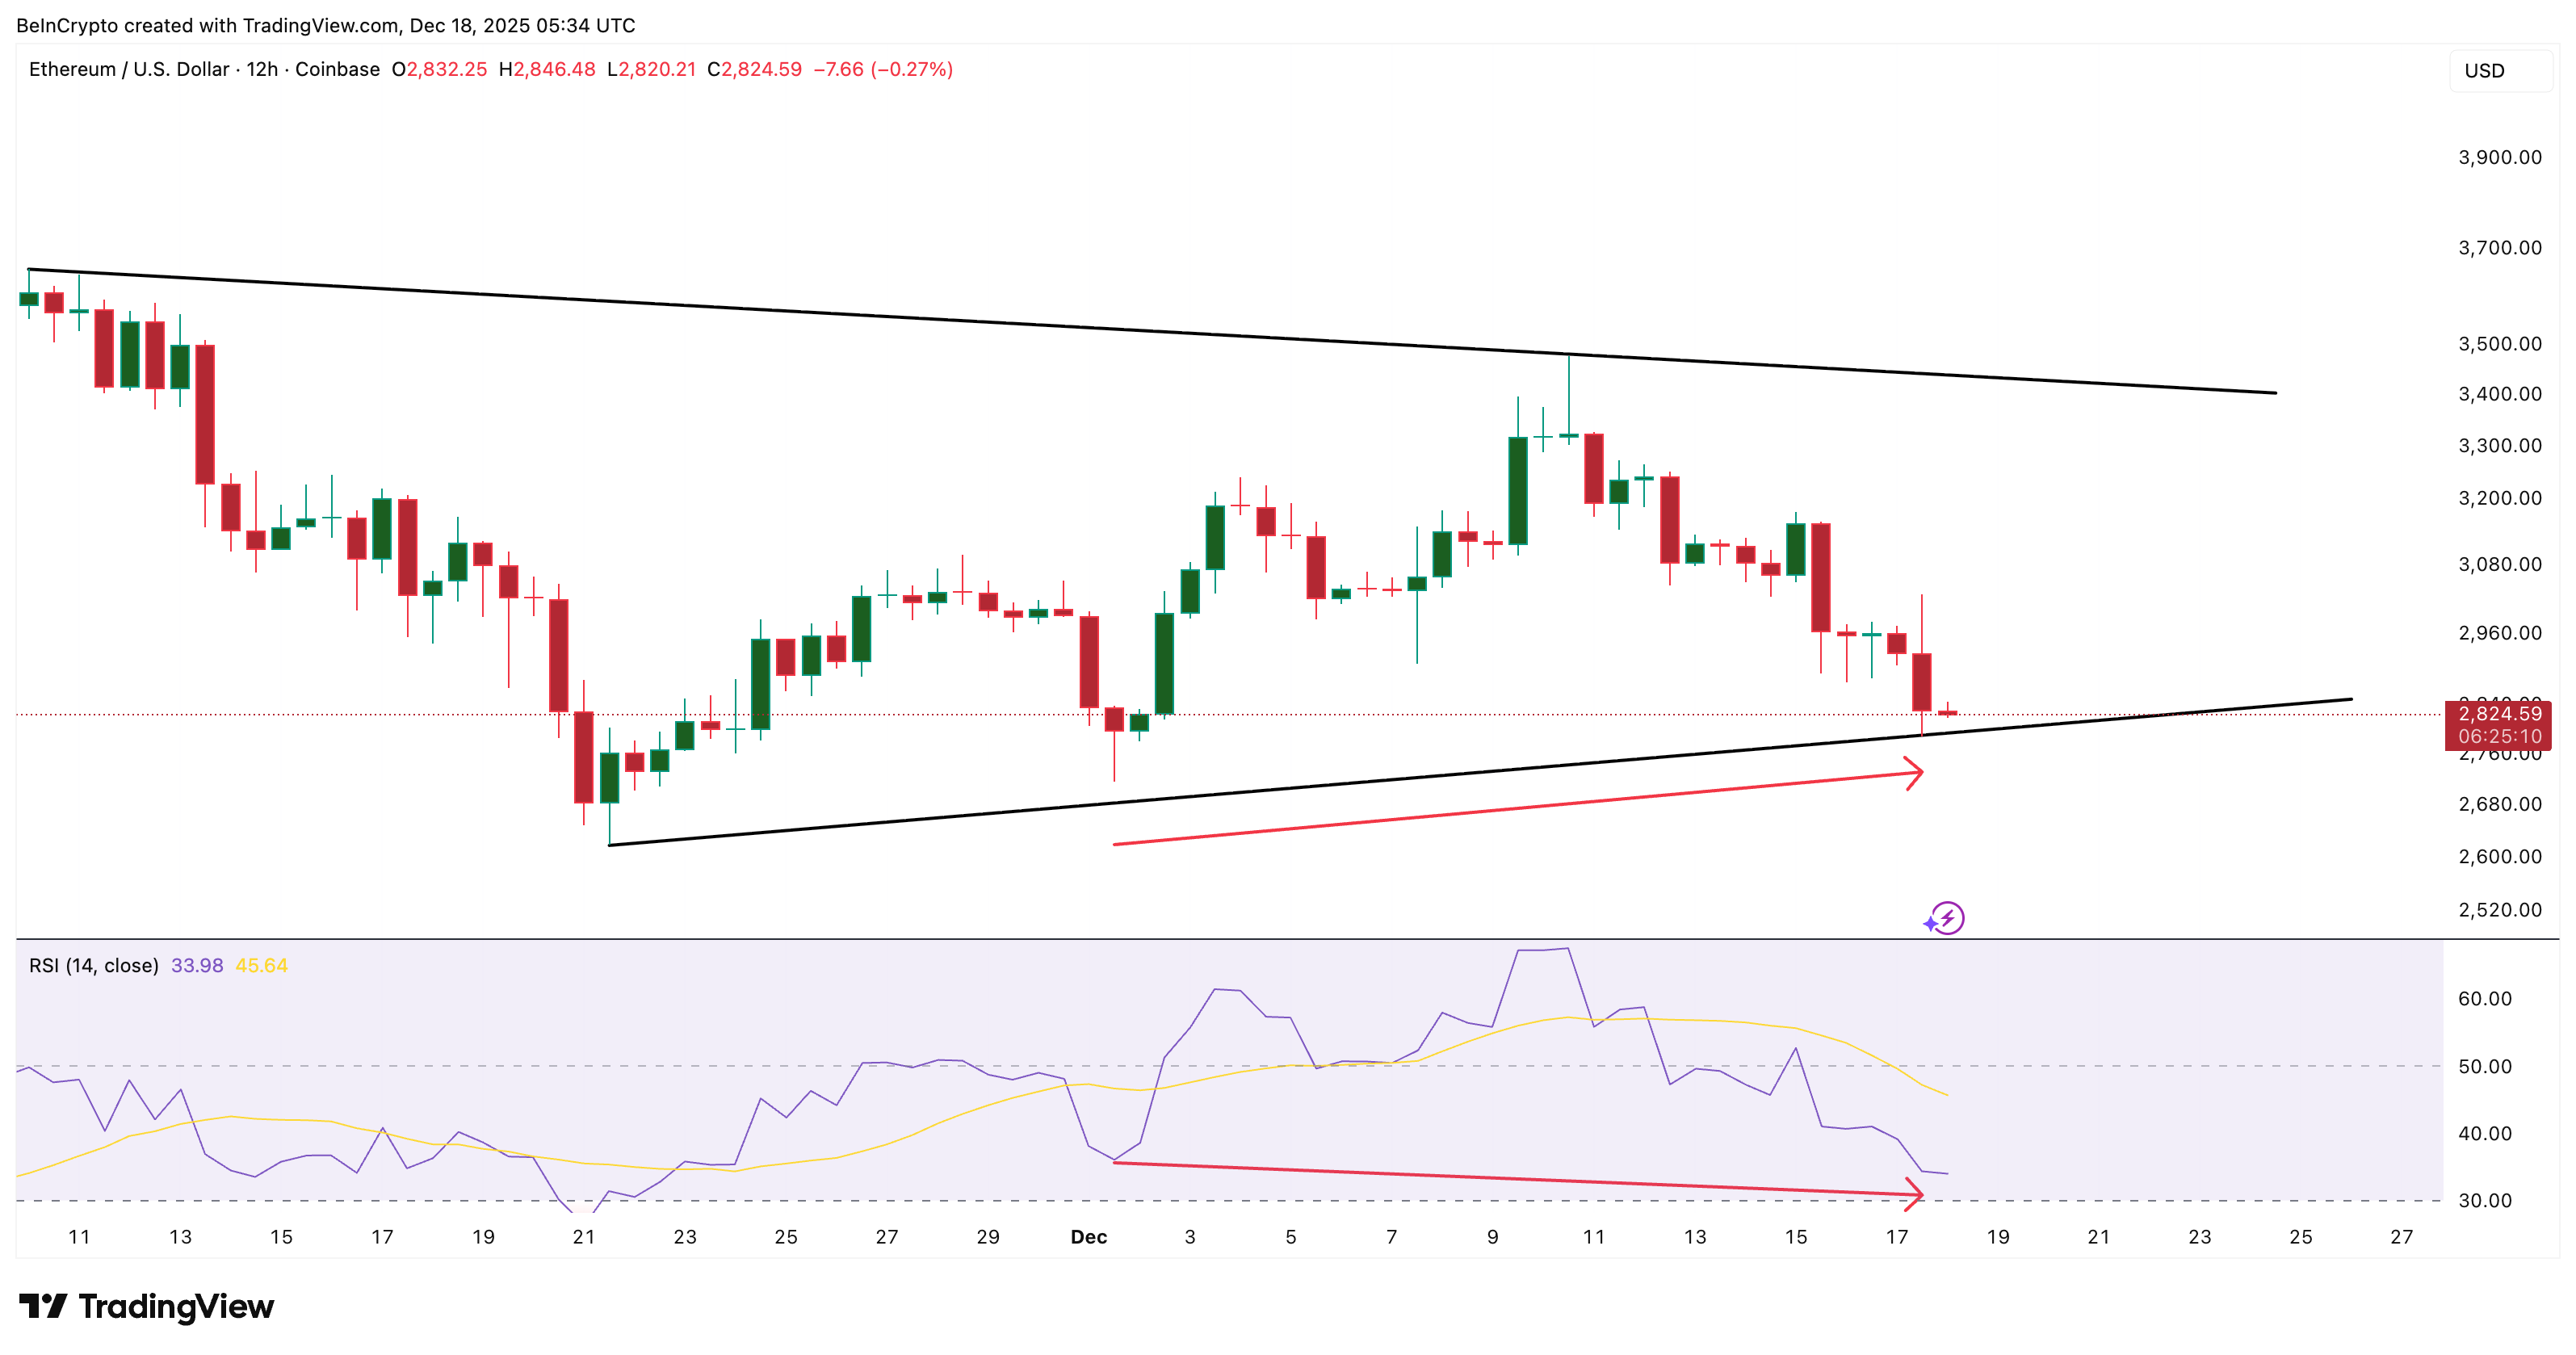
Hidden Bullish Divergence: TradingView
Want more token insights like this? Sign up for editor Harsh Notariya’s daily crypto newsletter here.
This setup does not guarantee a rally. However, as Ethereum approaches the structural support of the lower triangle trendline, it suggests that the downside pressure may be exhausted. Simply put, sellers are losing power, but buyers are not yet in control.
This makes the next move very sensitive to the key level.
Cost-based data shows where Ethereum price rebound could stall
On-chain cost-based data helps explain why upside remains limited.
The strongest short-term resistance lies between $3,154 and $3,179, with approximately 2.8 million ETH accumulated. This is a mass supply zone. When the price returns to this range, many holders tend to break even and sell.
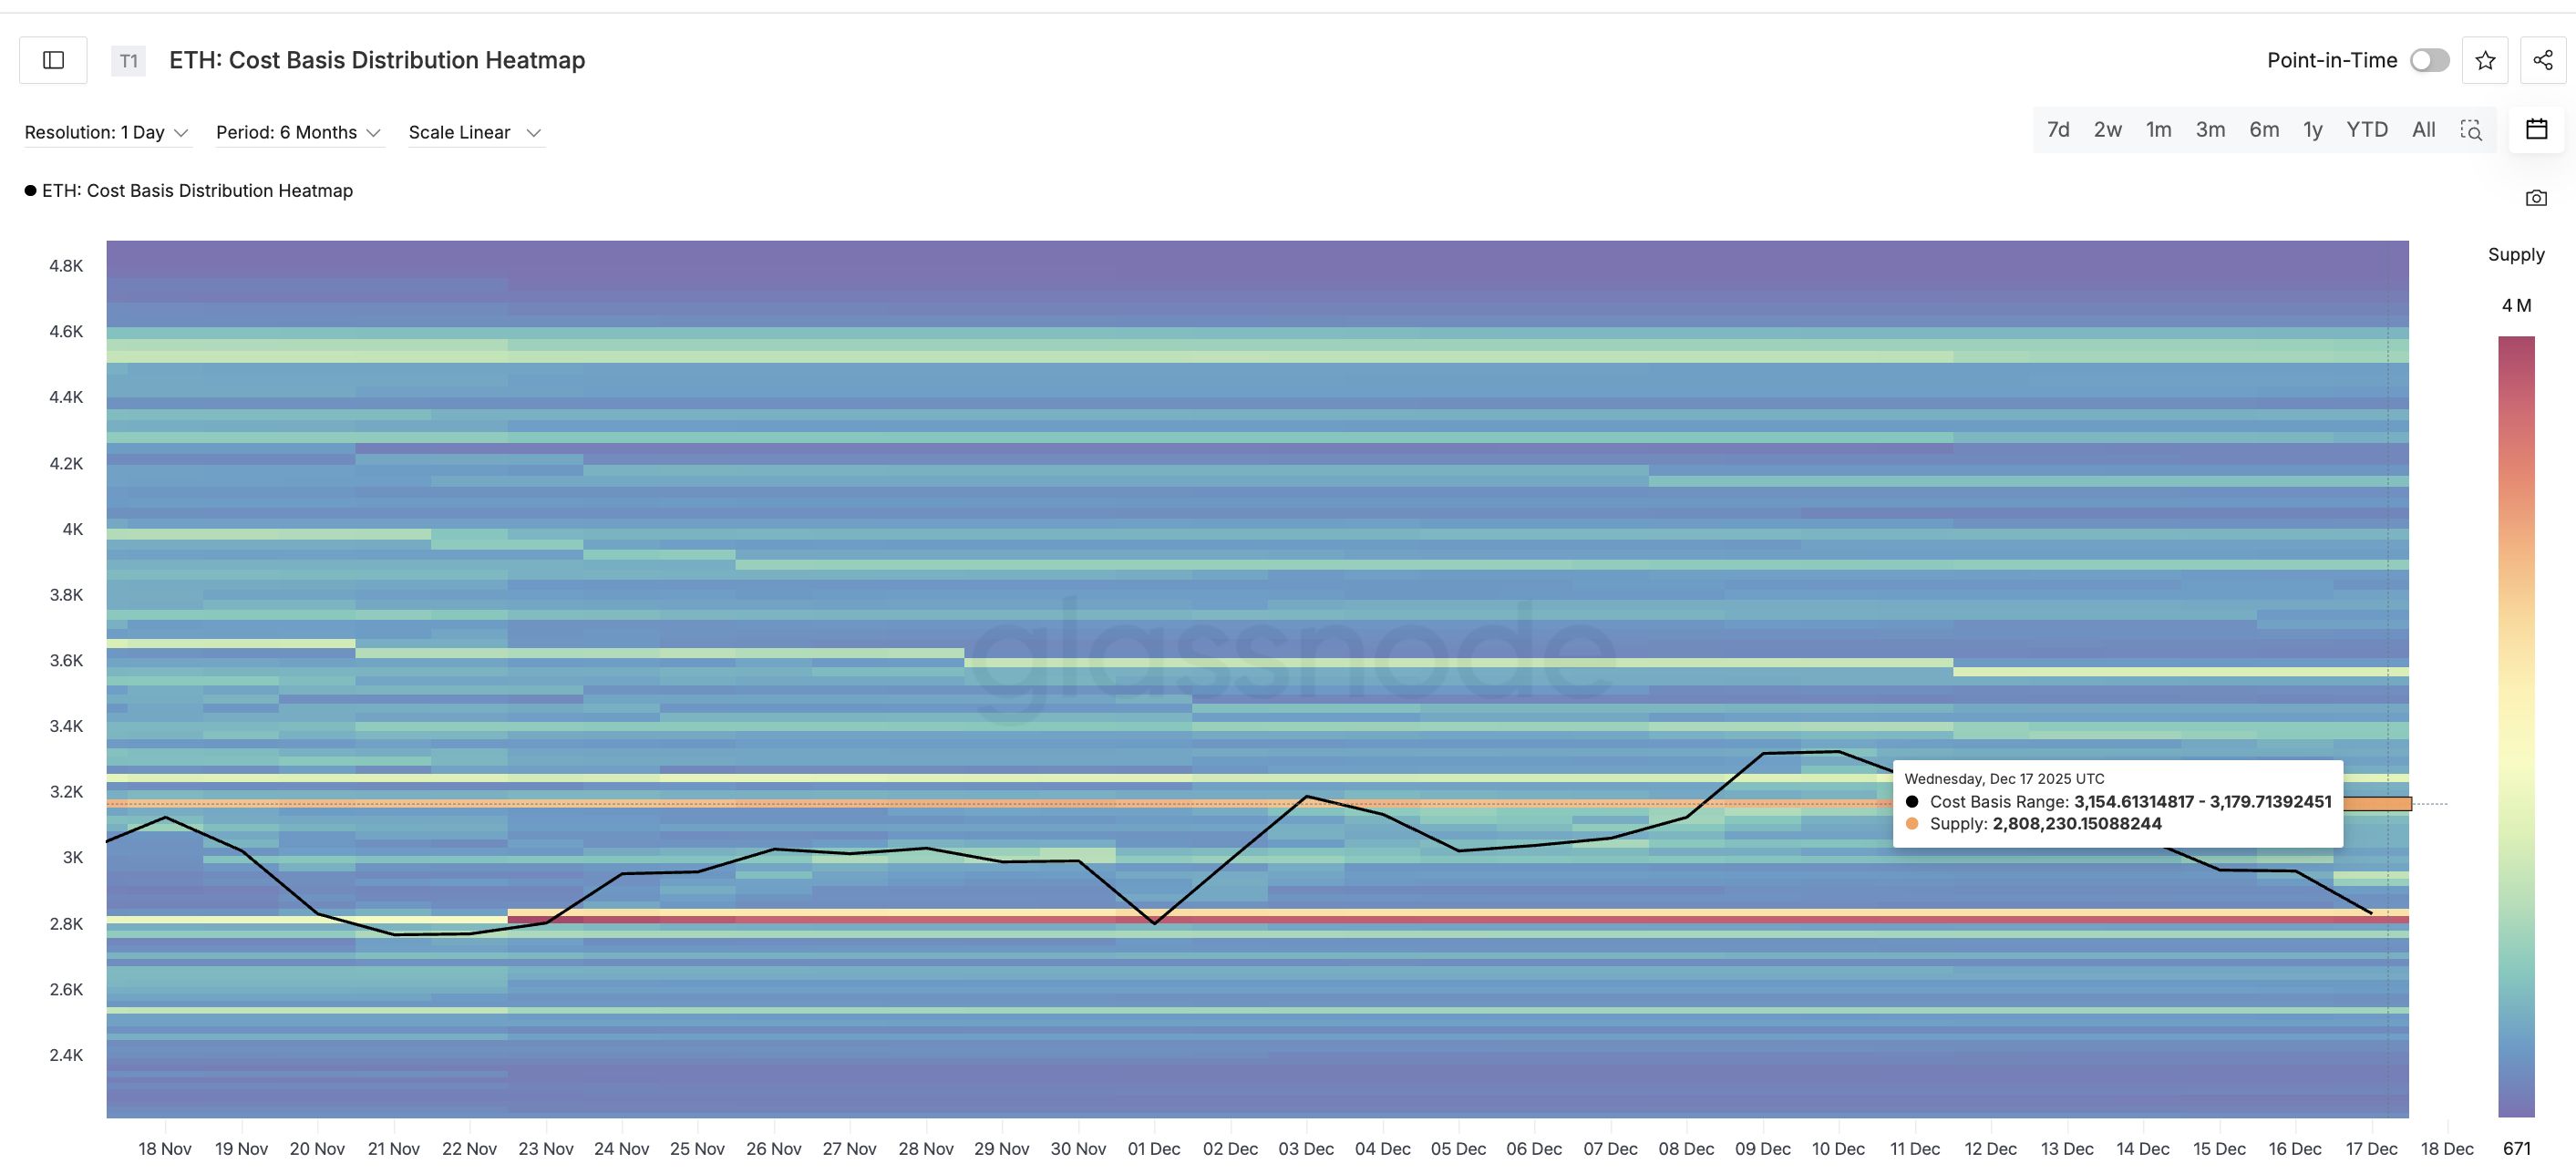
Main supply cluster: Glassnode
This is roughly in line with chart resistance at $3,149 and represents an 11% upside from current levels. Even if Ethereum price rebounds, this zone is likely to attract selling unless price closes cleanly above. Therefore, a pullback where the daily closing price does not exceed this area is still considered a correction rather than a trend change.
The downside situation is even more fragile.
The most important support cluster is between $2,801 and $2,823. This range serves as a major demand zone. A daily close below $2,801 (also visible on the price chart) is a warning signal.
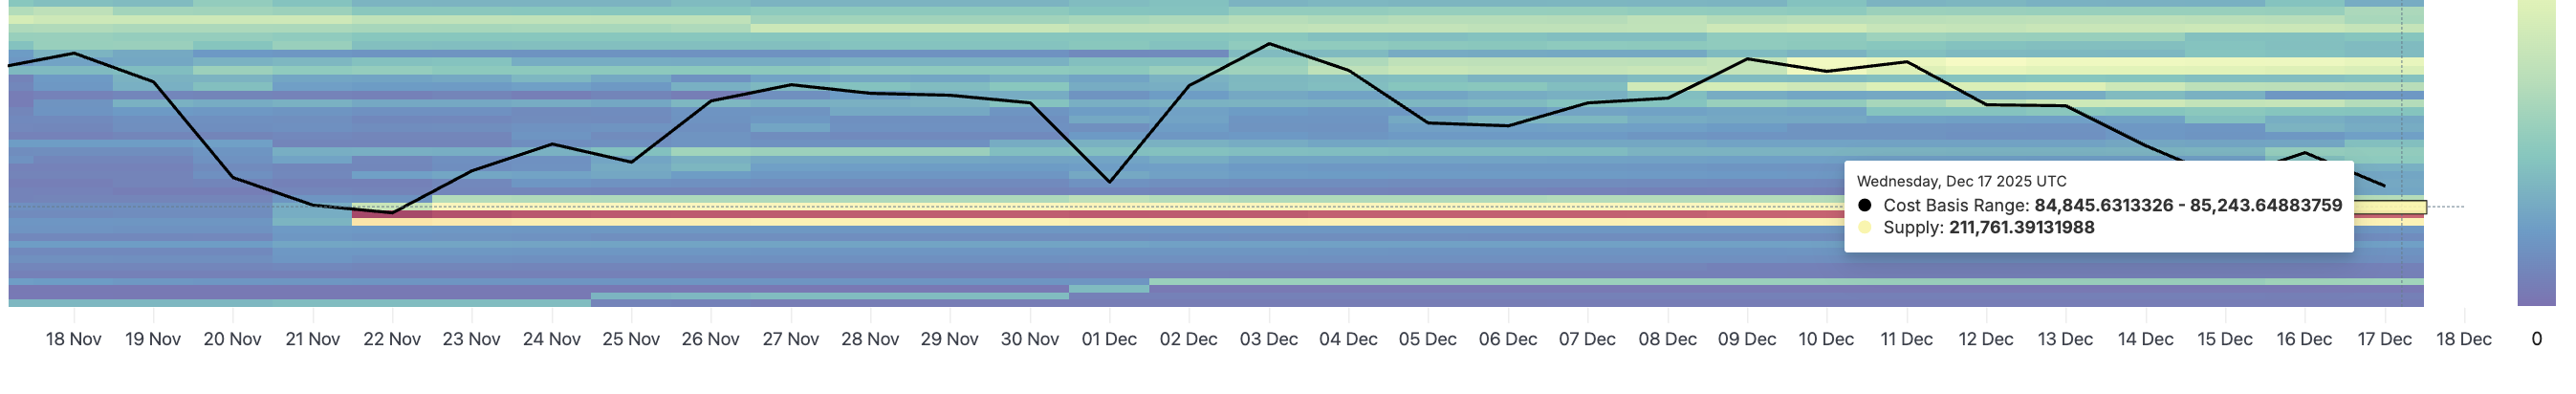
ETH Support Cluster: Glassnode
This move barely equates to a 1% downside break, but it could open the door to the next major support level on the chart at $2,617.
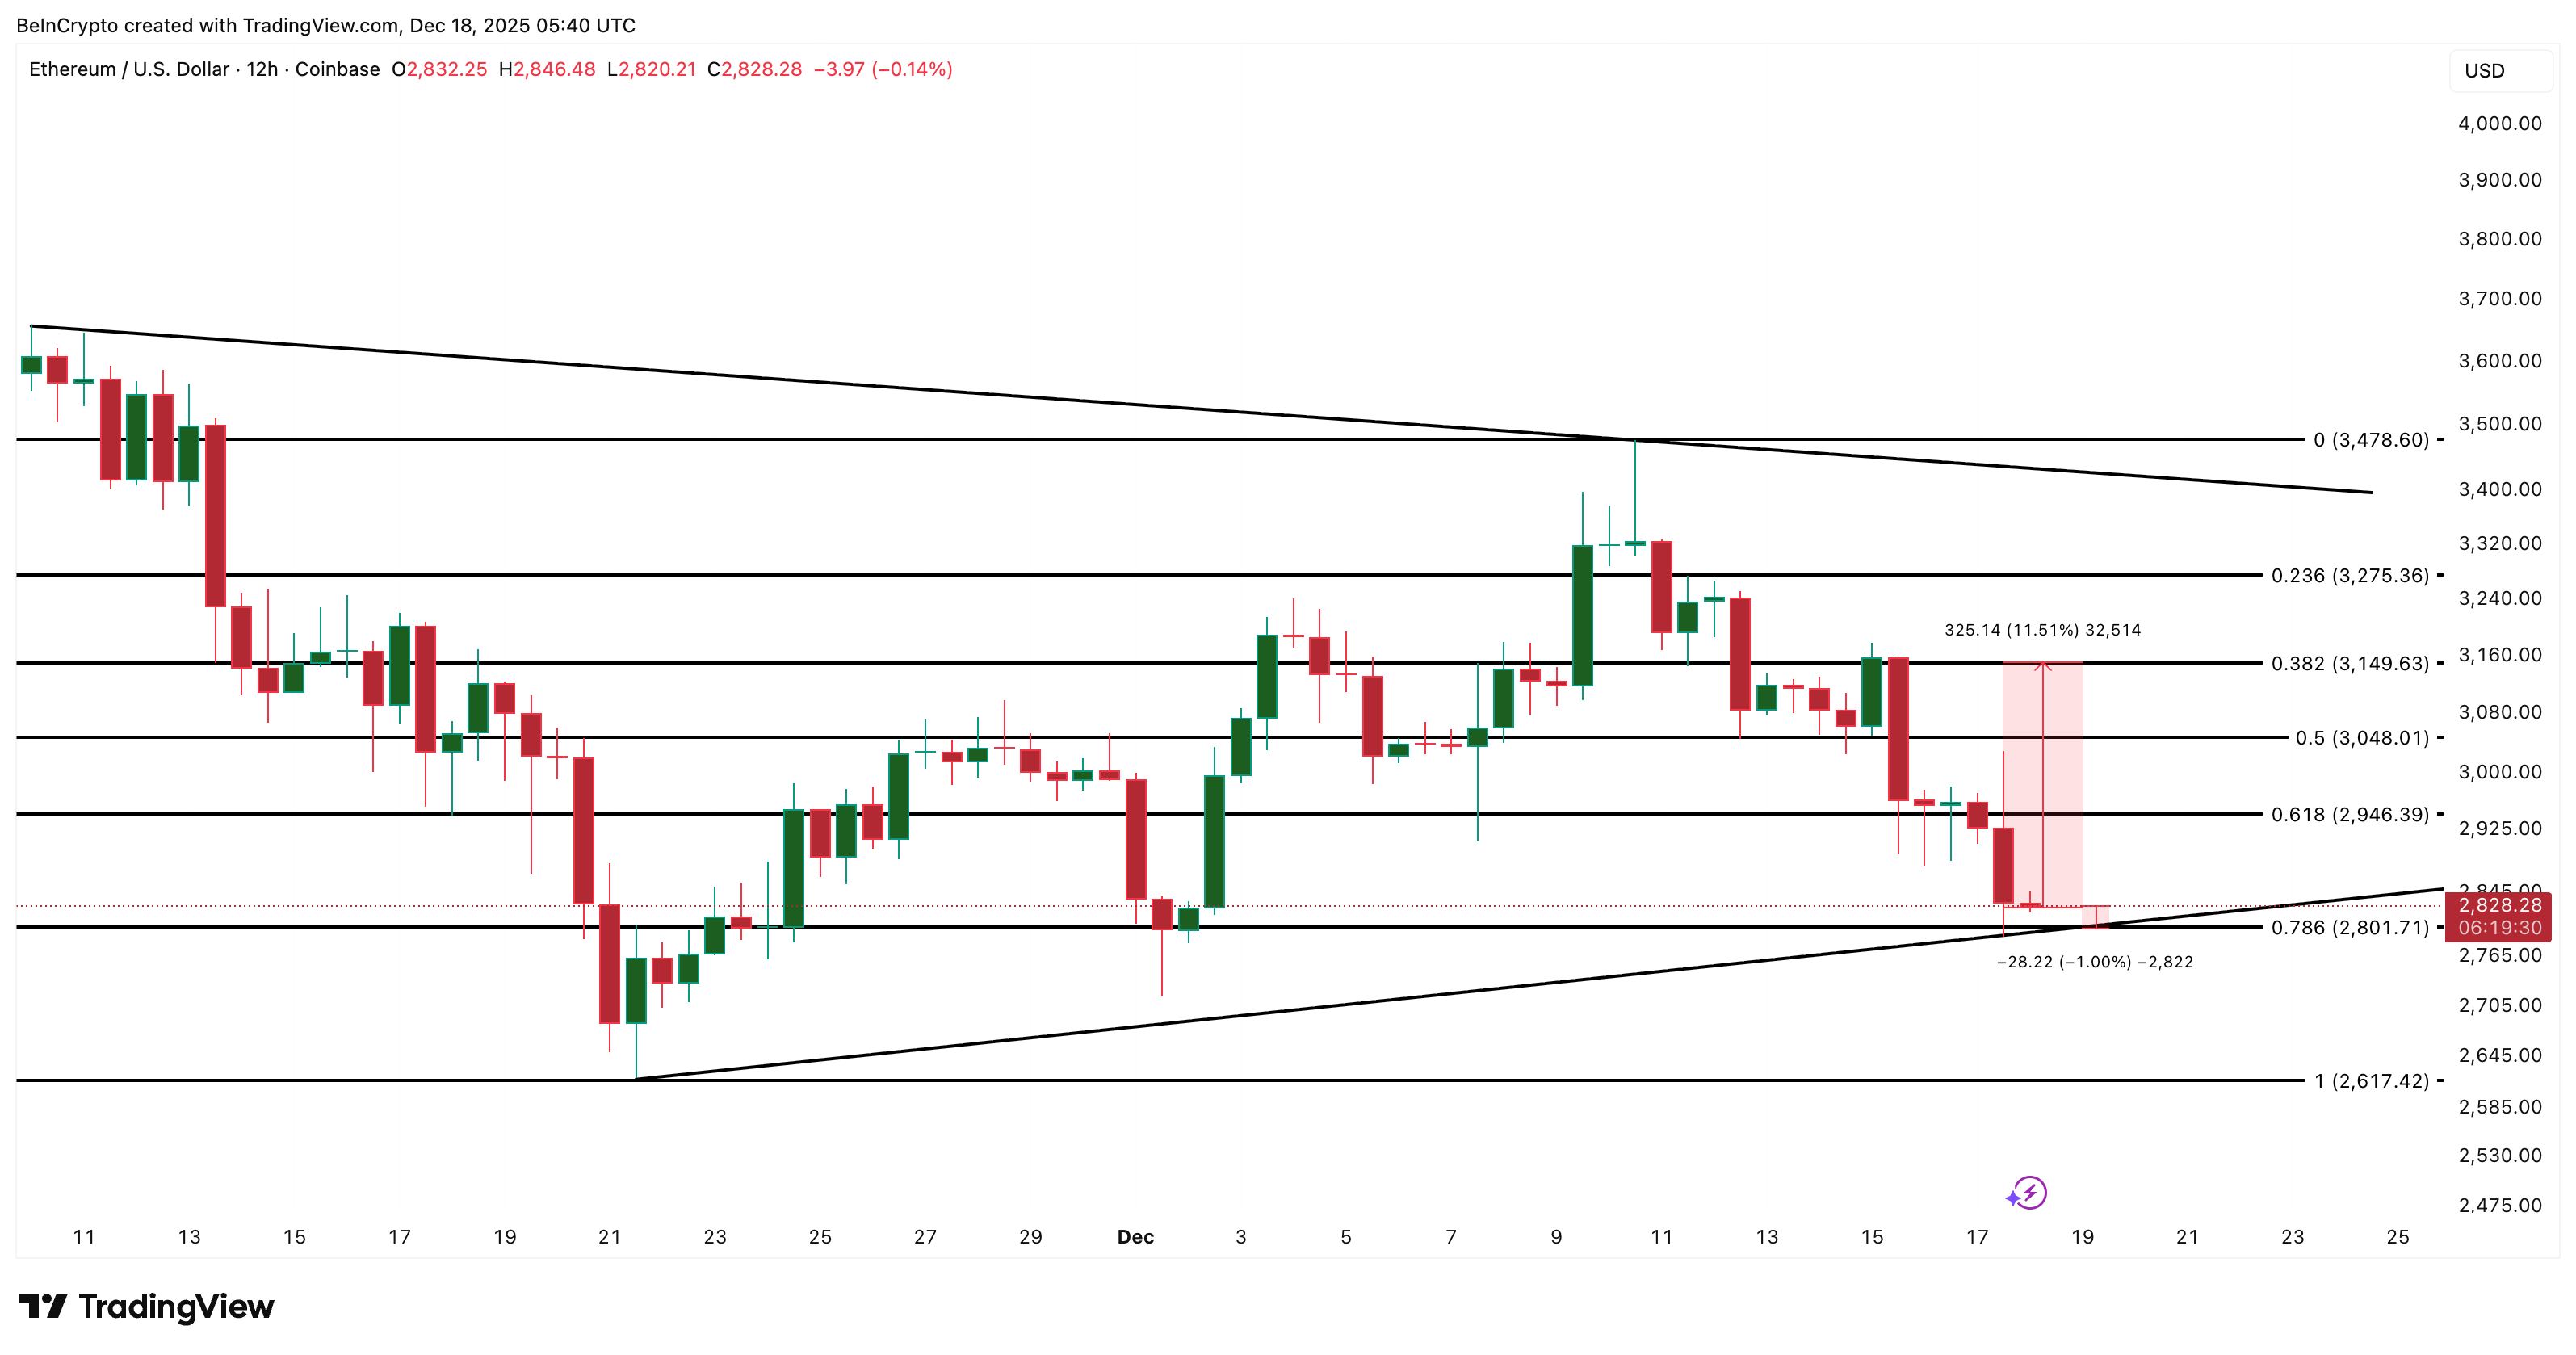
Ethereum Price Analysis: TradingView
This makes Ethereum’s current position dangerous. The upside can stall around 11%, but the downside risk starts with just a 1% failure.
The article “Ethereum Price Approaches a Possible Breakdown – Still, Hopes of a Bounce Emerge” was first published on BeInCrypto.