
Bitcoin is trading at $68,094 as of 8 a.m. EST on March 7, 2026, down 3.3% from the past 24 hours, with a market capitalization of approximately $1.36 trillion and daily trading volume of approximately $39.07 billion. The leading cryptocurrency remained within a range of $67,495 to $70,423 during the day, but technical indicators across multiple time frames indicated the market was structurally tilted to the downside.
Bitcoin chart outlook
On the daily chart, Bitcoin remains in a broad downtrend after dropping from its all-time high zone around $122,582 to a recent swing low of $59,930, which corresponds to a drawdown of about 51% from its peak. The price has since recovered towards around $68,000, but the recovery is still tentative. The candlestick structure shows a large bearish entity dominating the early drop from $80,000 to $60,000, followed by an indecisive candlestick near the bottom, suggesting depletion rather than a complete reversal.
The current pivot is near $68,091, located between the major structural resistance near $80,000 and the key support near $59,930-$60,000. Movements in trading volume are becoming increasingly alarming. Trading activity spiked during declines but declined during rebounds, a pattern that typically reflects weak upside confidence.
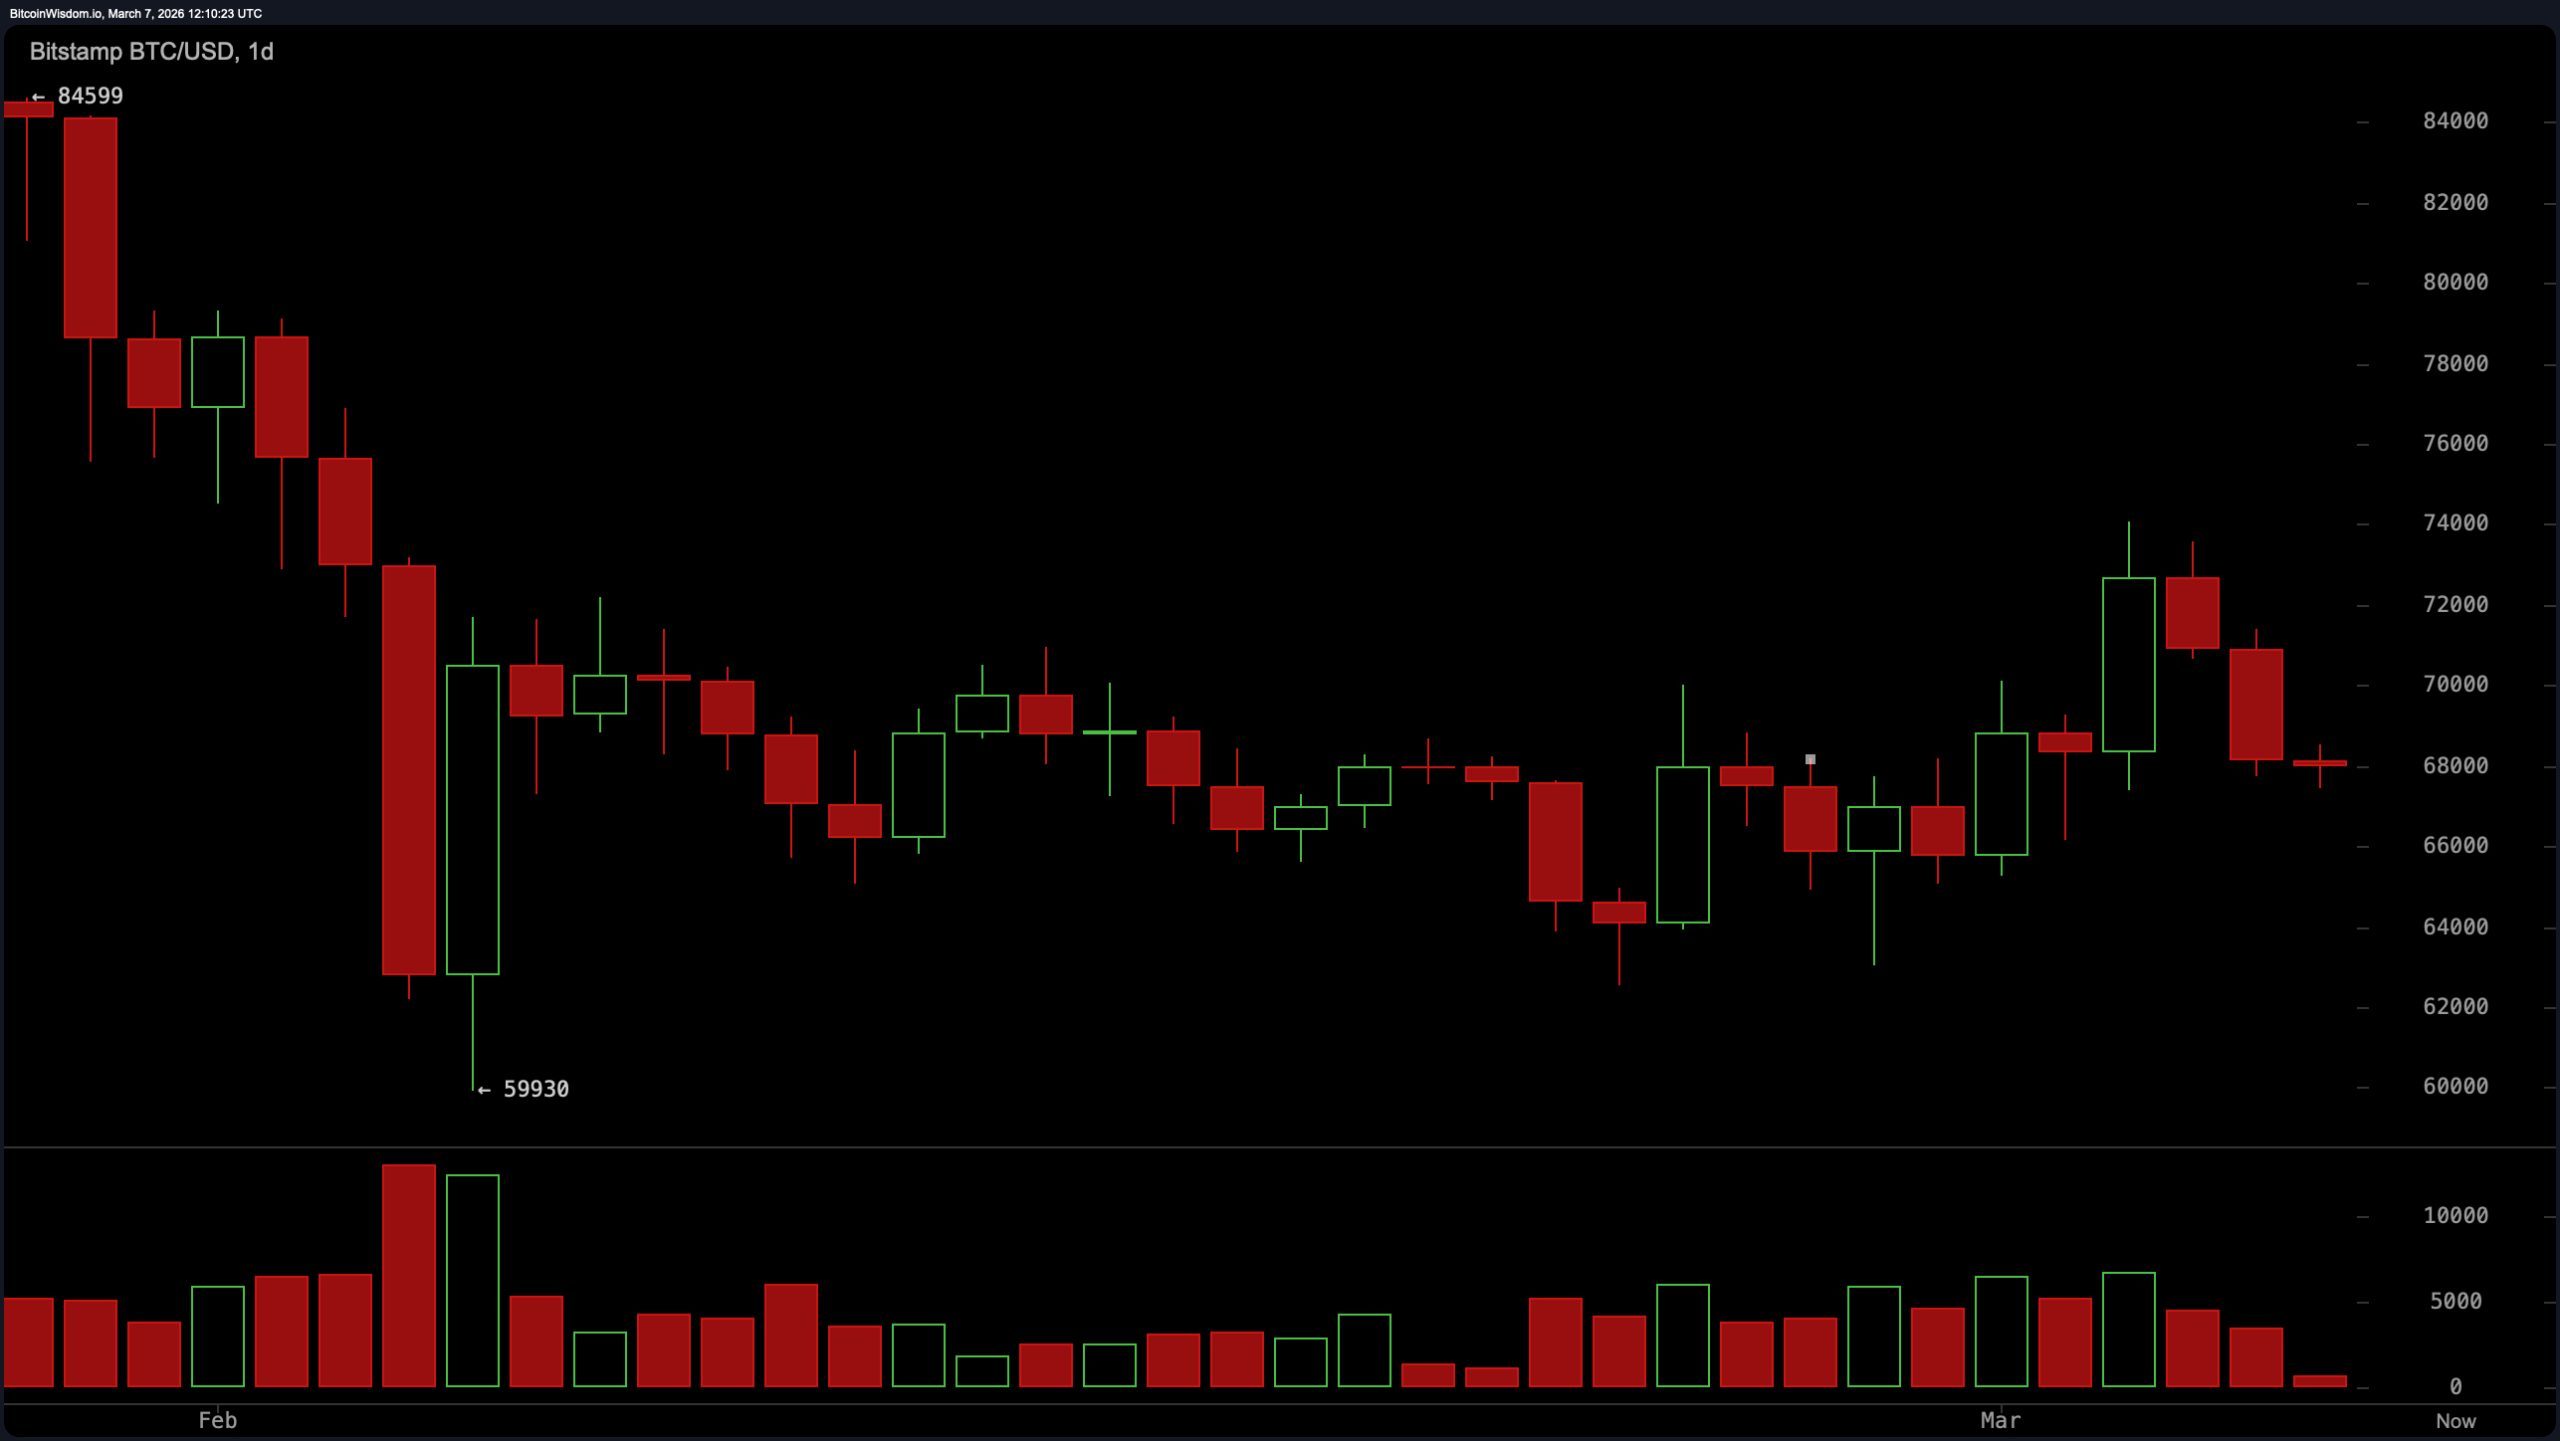
$BTC/USD 1-day chart via Bitstamp on March 7, 2026.
The 4-hour Bitcoin chart also tells a similar story with a little more drama. Bitcoin made a sharp rally from $62,525 to $74,075 before momentum suddenly reversed and produced a series of lows below that peak. The decline from $74,075 unfolded with aggressive red candlesticks, hinting at a distribution after a brief rally. The price is currently hovering around the $68,000 to $68,400 support zone, which is effectively the market’s current decision point. Immediate resistance lies near $70,000, but deeper support appears to lie around $66,000 and ultimately $62,525. Volume expanded during both the rally and the subsequent reversal, but declined as prices consolidated. This suggests that traders are waiting for clues on the next direction rather than chasing the current range assiduously.
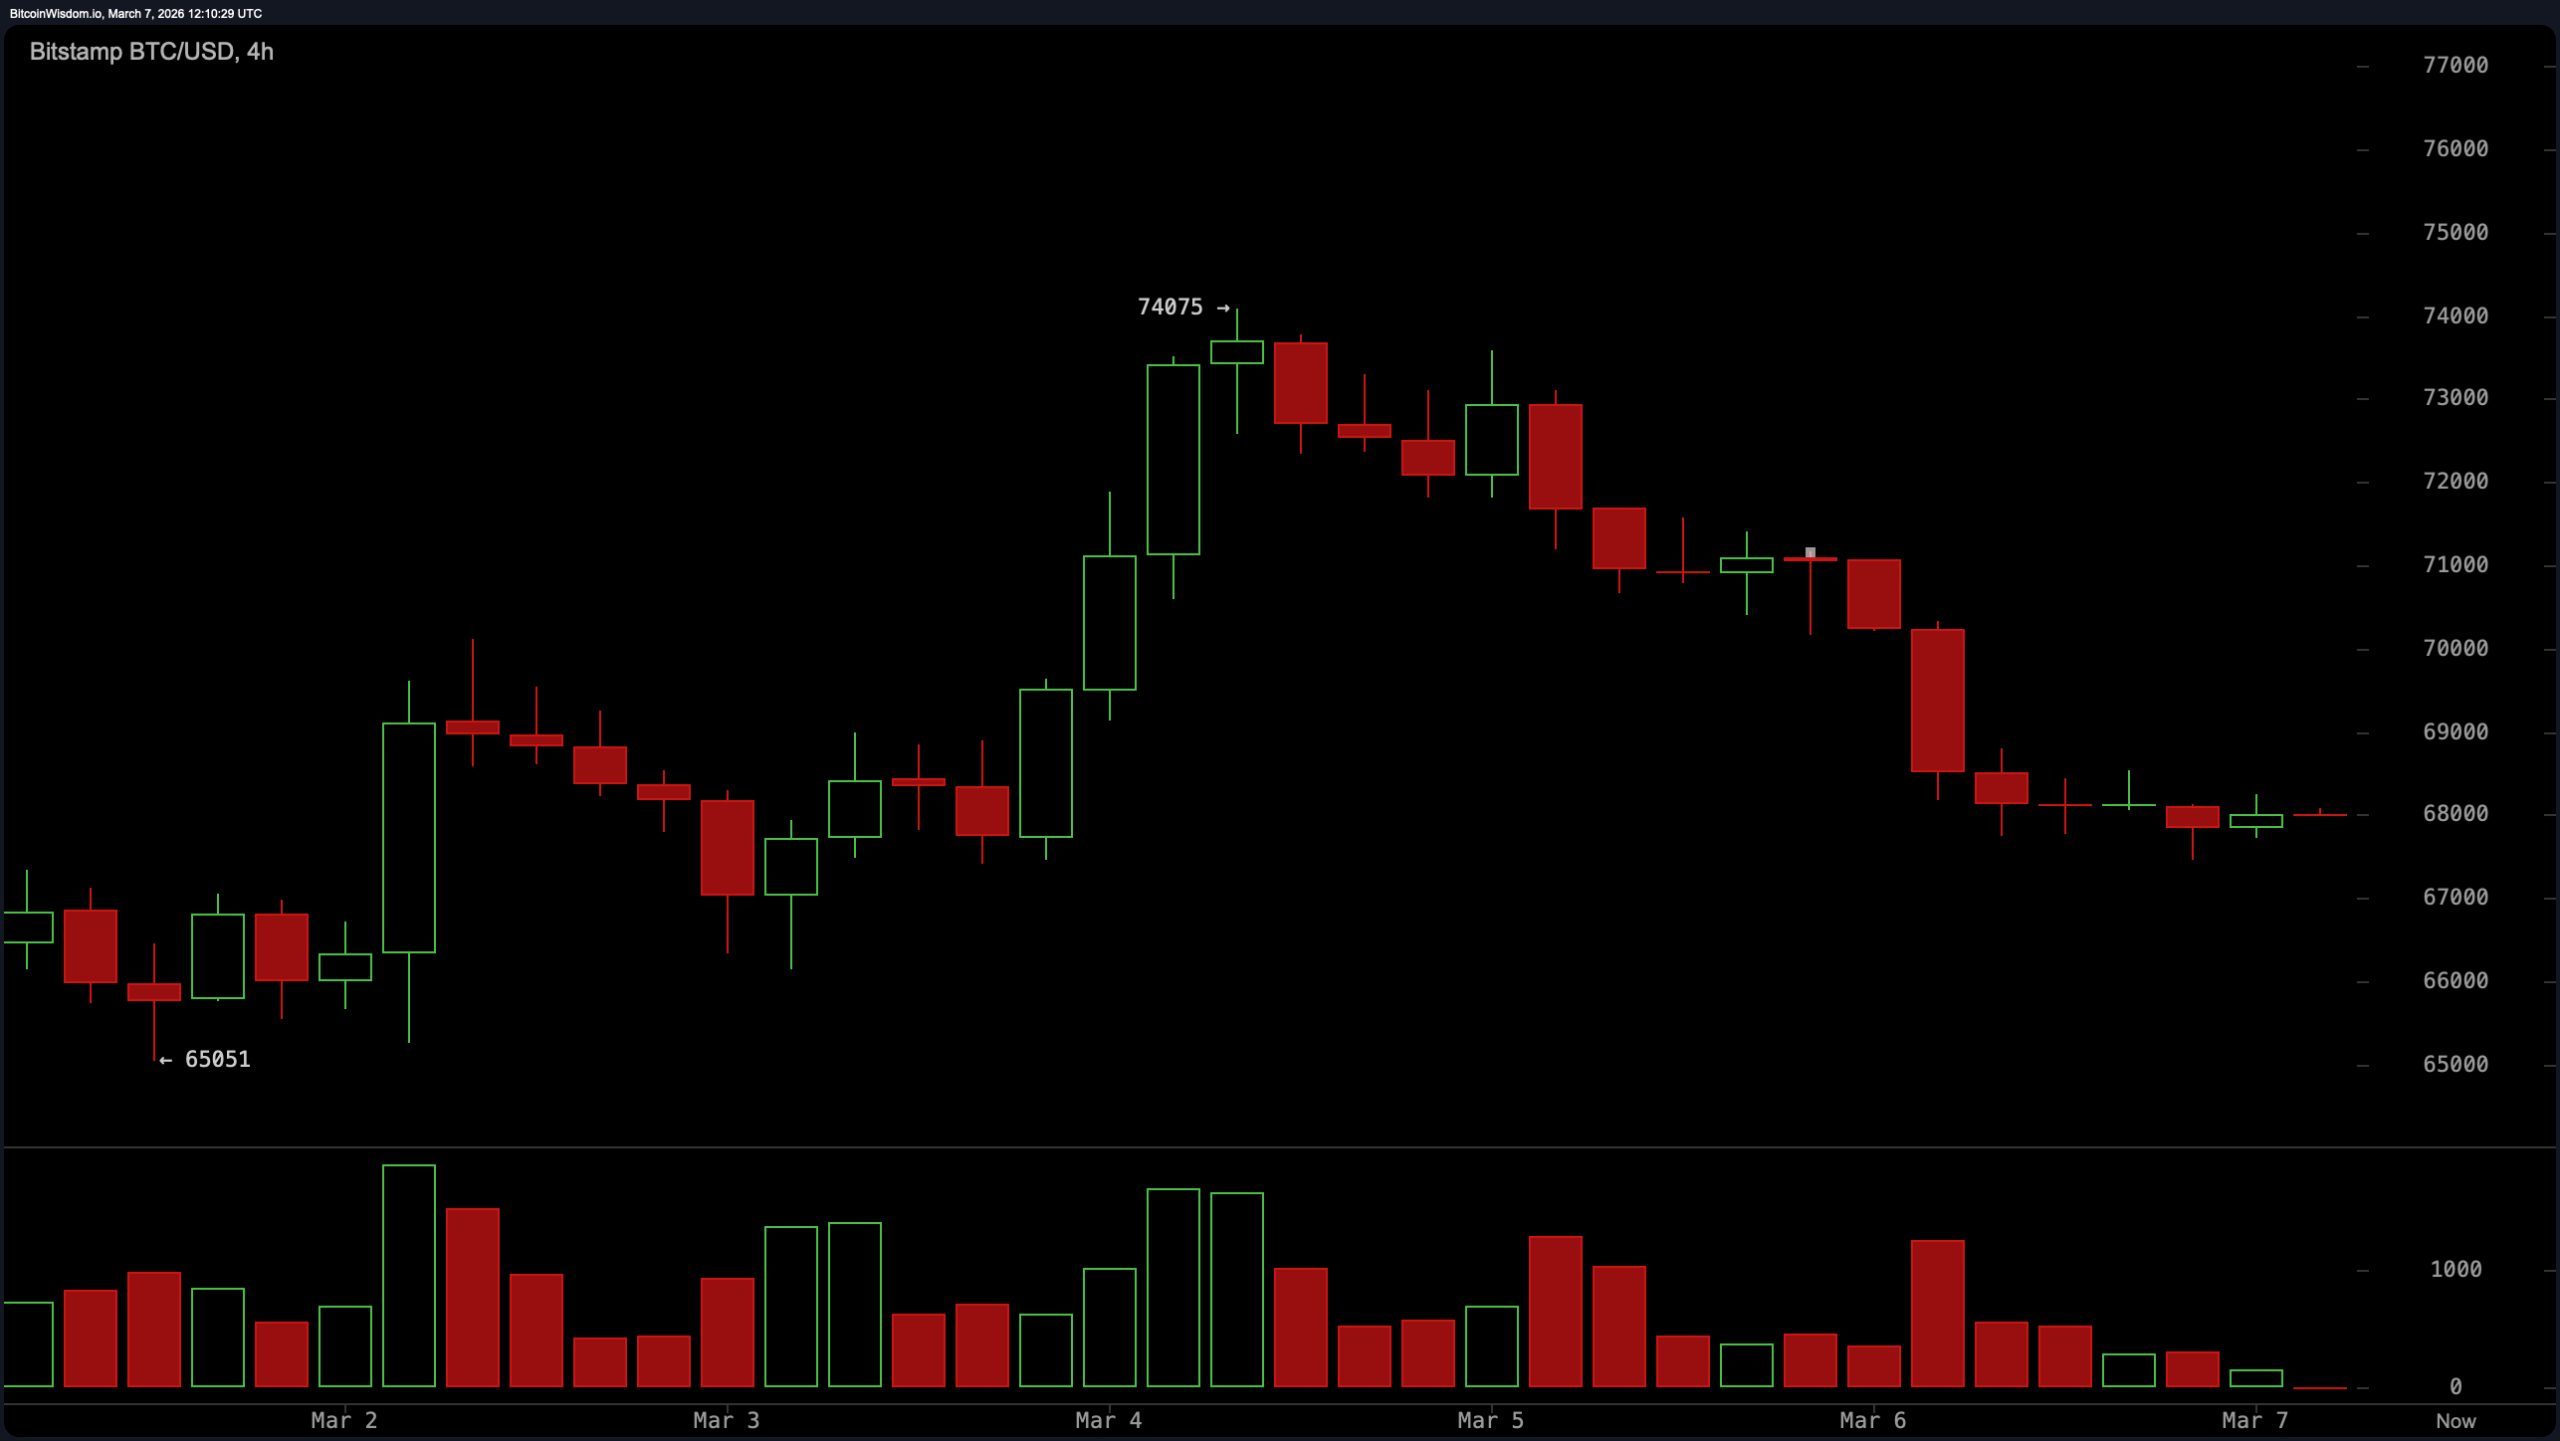
$BTC/USD 4-hour chart via Bitstamp on March 7, 2026.
On the hourly chart, the microstructure is negatively tilted as the price follows a descending channel from the $74,075 high. This pattern produced consistent highs and lows and was repeatedly rejected near the $70,000 to $71,000 zone, forming a visible shooting star candle. Immediate resistance lies between $68,500 and $68,800, while short-term support lies near $67,800 and $67,500. The chart also shows compression. The inner bar and small candlestick are clustered around the pivot at $68,000, indicating decreasing volatility ahead of a potential expansion. A hammer-style candlestick near $67,800 reveals intermittent demand, but so far it has merely slowed the decline rather than reversing the short-term trend.
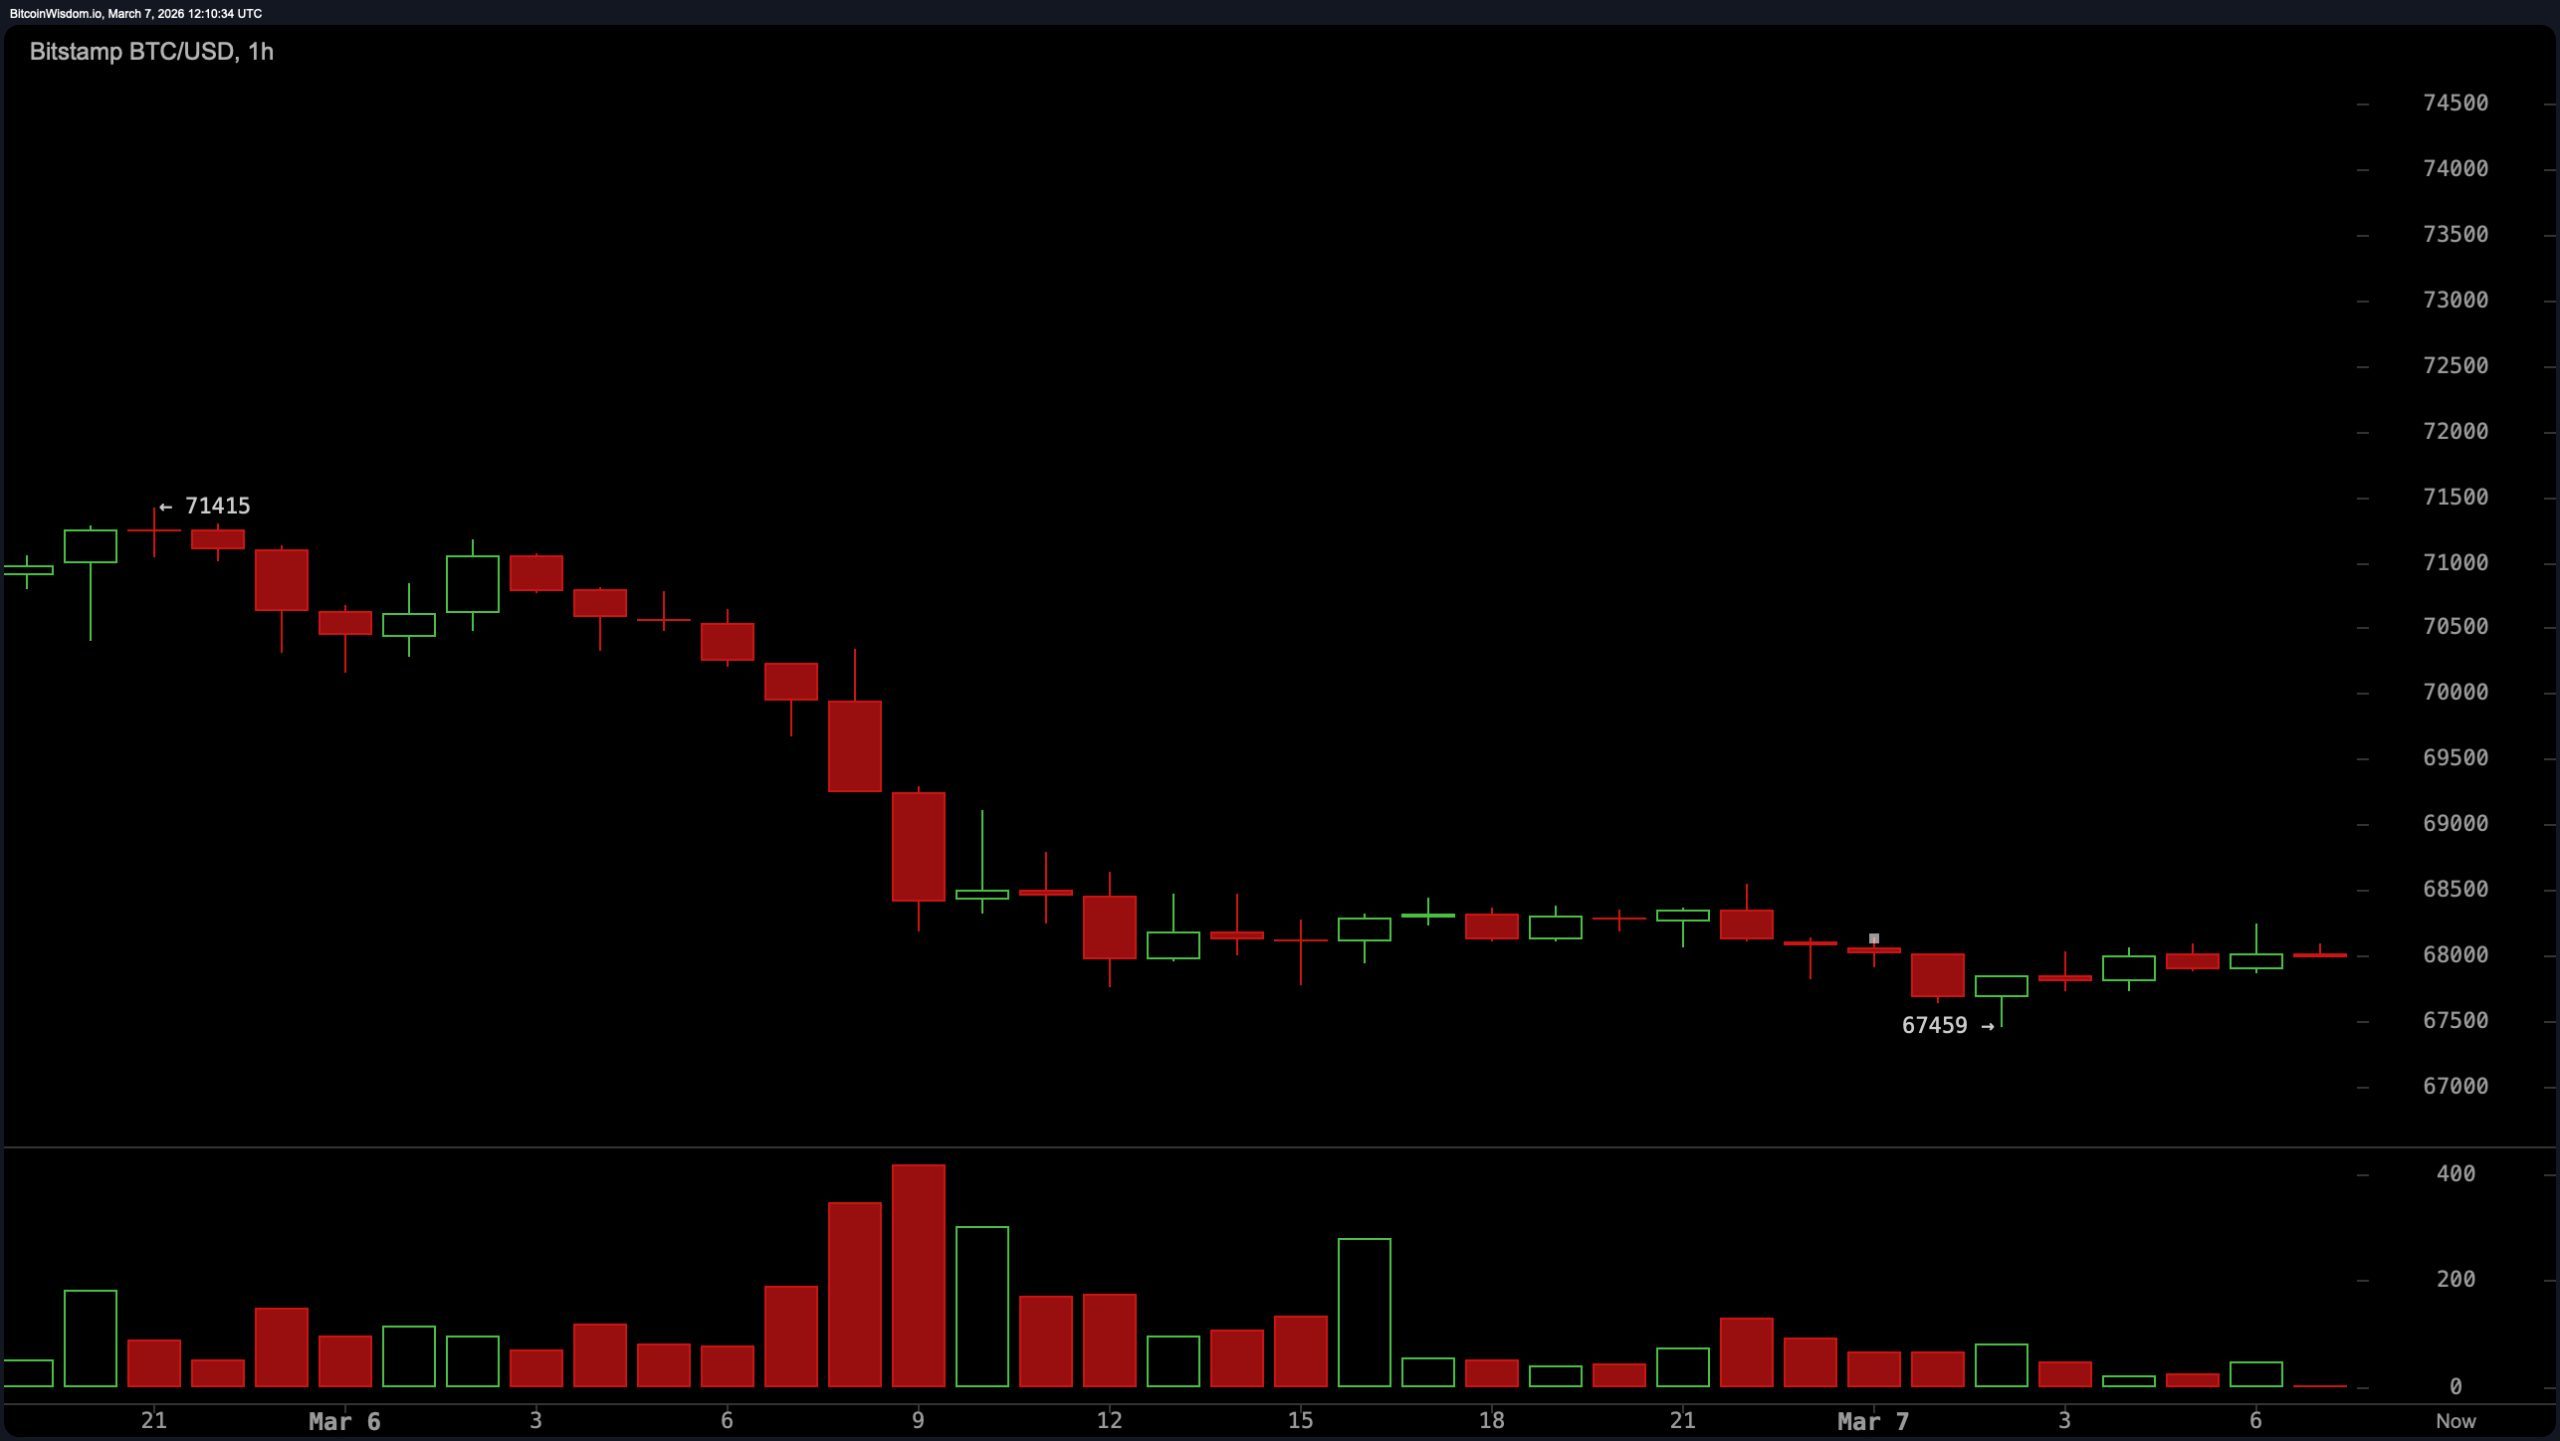
$BTC/USD 1-hour chart via Bitstamp on March 7, 2026.
The oscillators collectively paint a picture of neutrality rather than depletion. The relative strength index (RSI) is 46, which is between overbought and oversold territory. The probability register is 56, the Commodity Channel Index (CCI) (20) is around 23 and the Average Directionality Index (ADX) is 37, consistent with a market lacking decisive momentum.
The Awesome Oscillator remains positive at 1,029 while the Momentum Indicator is showing a negative signal and the Moving Average Convergence Divergence (MACD) level is below zero at -1,167 but producing a positive signal. In total, the oscillator set generates eight neutral signals (two negative and one positive). This is the market equivalent of a shrug.
However, moving averages are not very diplomatic. Bitcoin is currently trading below all major exponential moving averages, including EMA (10) at $68,560, EMA (20) at $68,867, EMA (30) at $70,300, EMA (50) at $73,802, EMA (100) at $81,194, and EMA (200) at $89,321. The simple moving average (SMA) (10) is $68,310 and the SMA (50) is $74,743, both of which are above the price, but longer-term indicators such as the SMA (100) of $82,428 and the SMA (200) of $95,667 are looming much overhead.
Only the SMA of $67,654 (20) and the SMA of $68,090 (30) generate positive signals. The Ichimoku reference line (9, 26, 52, 26) is near $68,300 and is neutral. In total, the moving average stack produces 11 negative signals and 2 positive signals. This isn’t exactly the attitude of a raging bull market for those keeping score at home.
Bullish verdict:
For a bullish shift, Bitcoin needs to regain the immediate resistance between $68,500 and $70,000 while maintaining volume and break out of a series of lows seen on the 1-hour and 4-hour charts. A move above $70,000 would invalidate the downside short-term structure, paving the way for the recent swing high of $74,075. Above that level, the broader market will start testing heavier structural resistance around $80,000 on the daily chart. The oscillators, including the Relative Strength Index (RSI) of 46, remain largely neutral, leaving room for upward momentum if prices regain key levels. So if we regain the range and break out of the low-to-high pattern, the recovery story will immediately gain credibility.
Bear verdict:
The bear case for Bitcoin remains technically dominant as long as Bitcoin stays below the $68,500 resistance zone and below most major moving averages. A decisive break below the $67,800 support level on the hourly chart confirms the continuation of the descending channel and will likely expose the next pockets of liquidity around $67,000 and $66,500, with $65,051 emerging as the next major chart support. The broader structure reinforces that risk. Price remains below the 10-200 period exponential moving average (EMA) and below several long-term simple moving averages (SMAs). The prevailing technical bias continues to favor downside pressure until the market is able to reclaim higher resistance levels, with $62,525 representing the next major structural test on a deeper retracement.
Frequently asked questions 🔎
- Why is Bitcoin falling today? Bitcoin is down approximately 3.3% as of March 7, 2026, with technical indicators and moving averages showing sustained downward pressure.
- What are the current major support levels for Bitcoin?The most important short-term support lies around $67,800 to $68,000, with deeper supports near $65,051 and $62,525.
- What resistance level does Bitcoin need to break through for a recovery? Bitcoin needs to regain $68,500 and then $70,000 to regain short-term momentum.
- What are Bitcoin’s technical indicators showing today?Most oscillators are neutral, but the moving averages are showing strong downward pressure, indicating that the market is structurally bearish.