
Bitcoin was trading around $73,764 as of March 16, 2026 at 11:15 AM ET, with a 24-hour range of $71,389 to $74,387, for a market cap of $1.46 trillion and a total 24-hour volume of $48.85 billion. Data obtained on March 16, 2026 shows the leading crypto asset positioned near the top of its session range, while the short-term chart reflects a consolidation just below nearby resistance.
Bitcoin chart outlook
On the daily chart, Bitcoin is located within the verified intraday band, with price movement during the latest session holding between $71,389 and $74,387. The market remained at the top of that range, with most trading in the $73,000 to $74,000 range.
The reference levels displayed on the chart include the higher markers of 75,000, 83,500, and 87,500, while the lower reference levels appear around the 73,500, 73,000, and 72,500 areas. Within that context, the daily timeframe reflects price stability within a broader range rather than a definitive move above session highs.
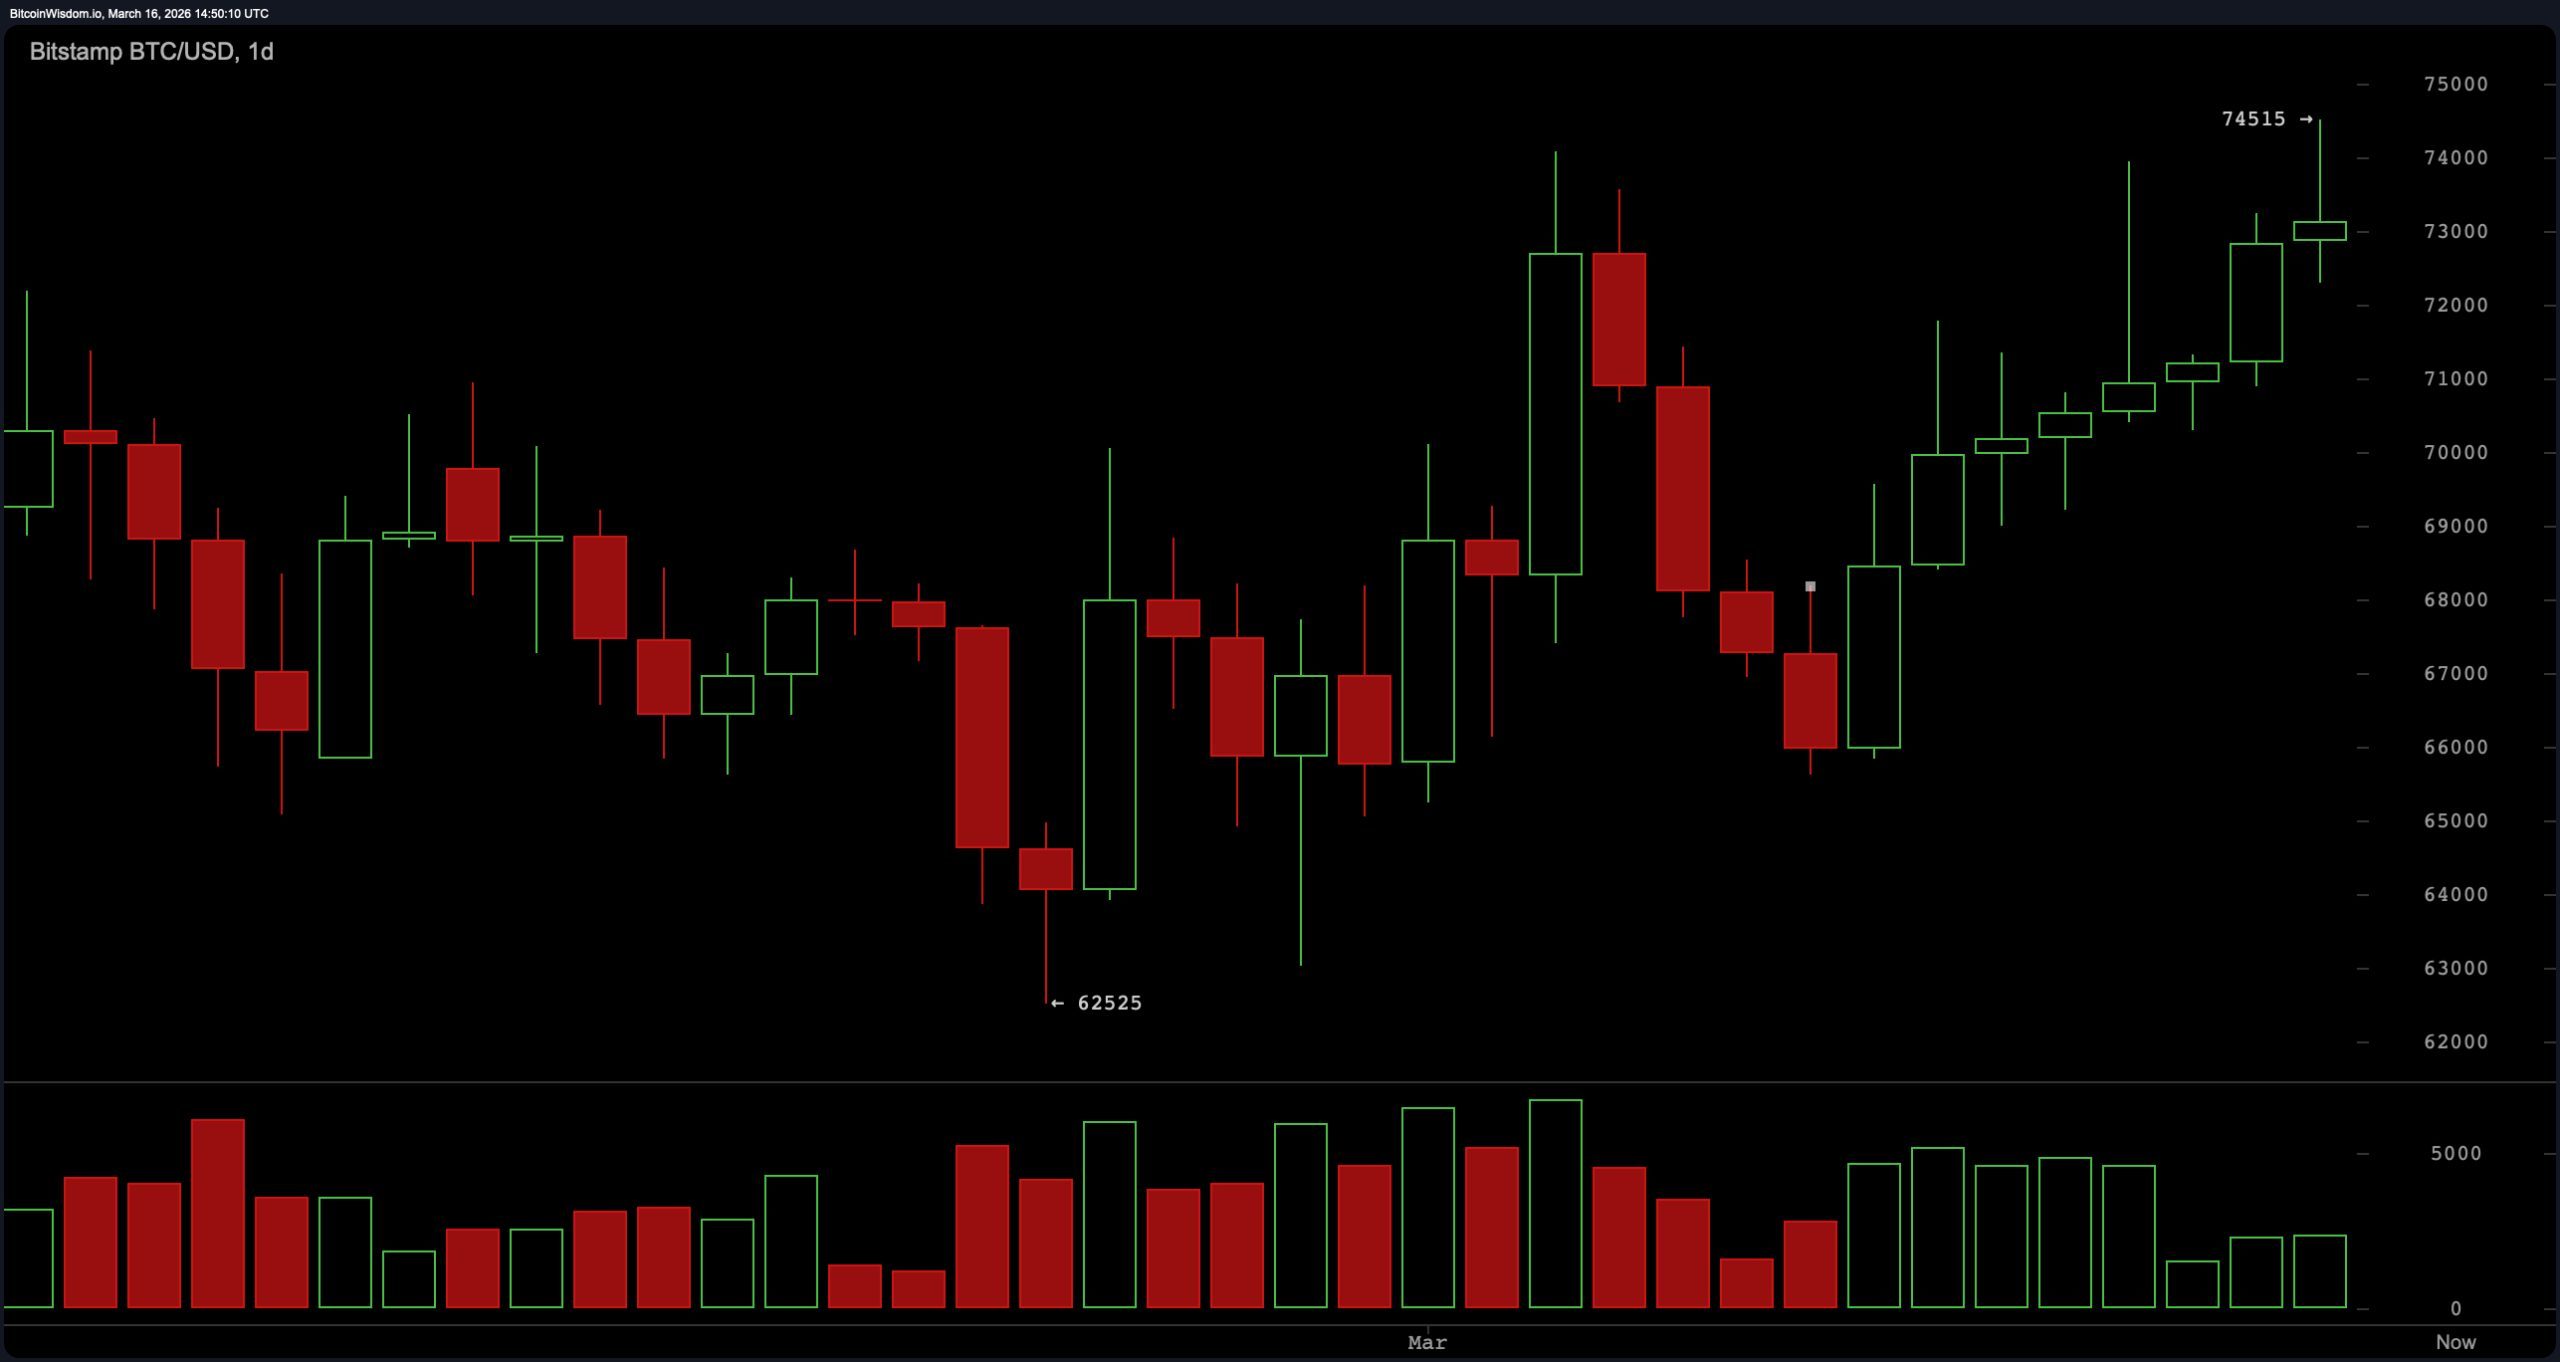
$BTC/USD 1-day chart via Bitstamp on March 16, 2026.
The price trend on the 4-hour chart shows that Bitcoin remains firm around the $73,800 to $73,851 area based on Bitstamp’s movement. Recent ticks on the chart indicate continued trading within that narrow band, suggesting a short-term compression after an earlier push towards the upper end of the session range. The short-term price structure remains above several lower moving average clusters referenced in the dataset between approximately $68,000 and $72,000. Therefore, the 4-hour timeframe reflects a lateral movement near resistance rather than a retracement to a deeper support level.
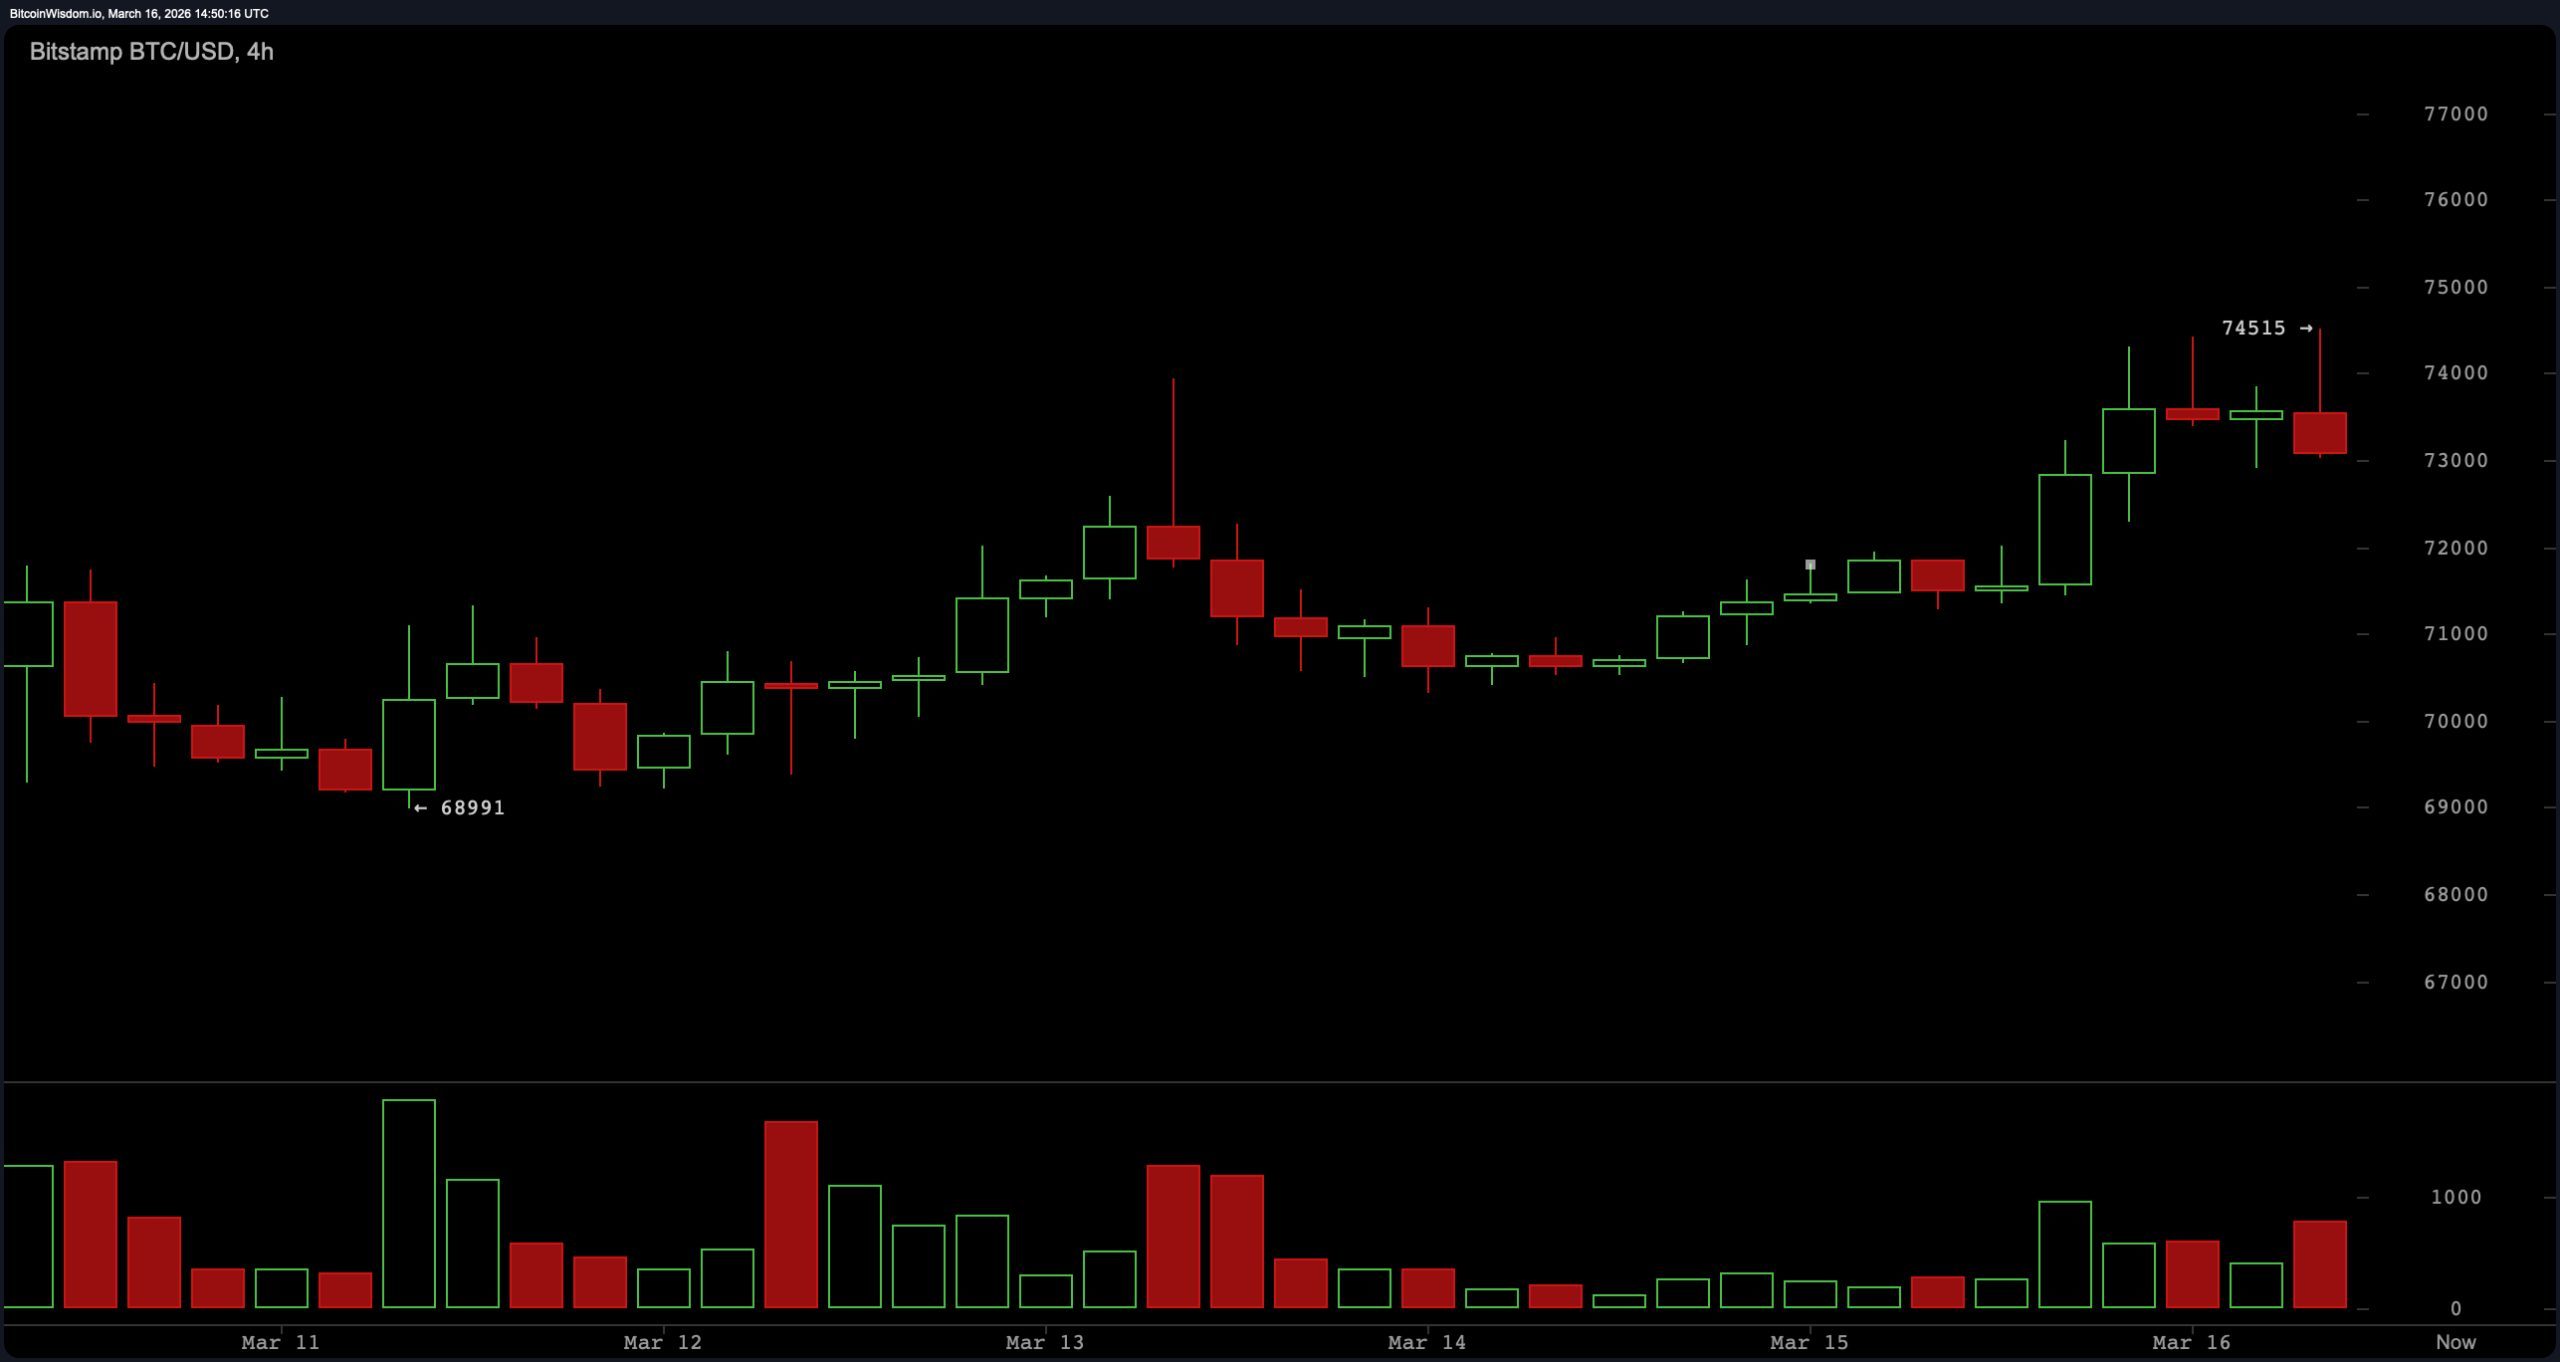
$BTC/USD 4-hour chart via Bitstamp on March 16, 2026.
The hourly chart shows a similar short-term consolidation with the price continuing to fluctuate in the low $73,000 zone. Instant order book levels indicate that the most recent trades were between approximately $73,800 and $73,851, with average buy and sell prices near $73,829 and $73,791, respectively. These levels place current trading slightly above both averages, but the difference remains minimal. Therefore, the hourly time frame reflects narrow price movements within a defined range, with the market hovering just below the session’s high water mark.
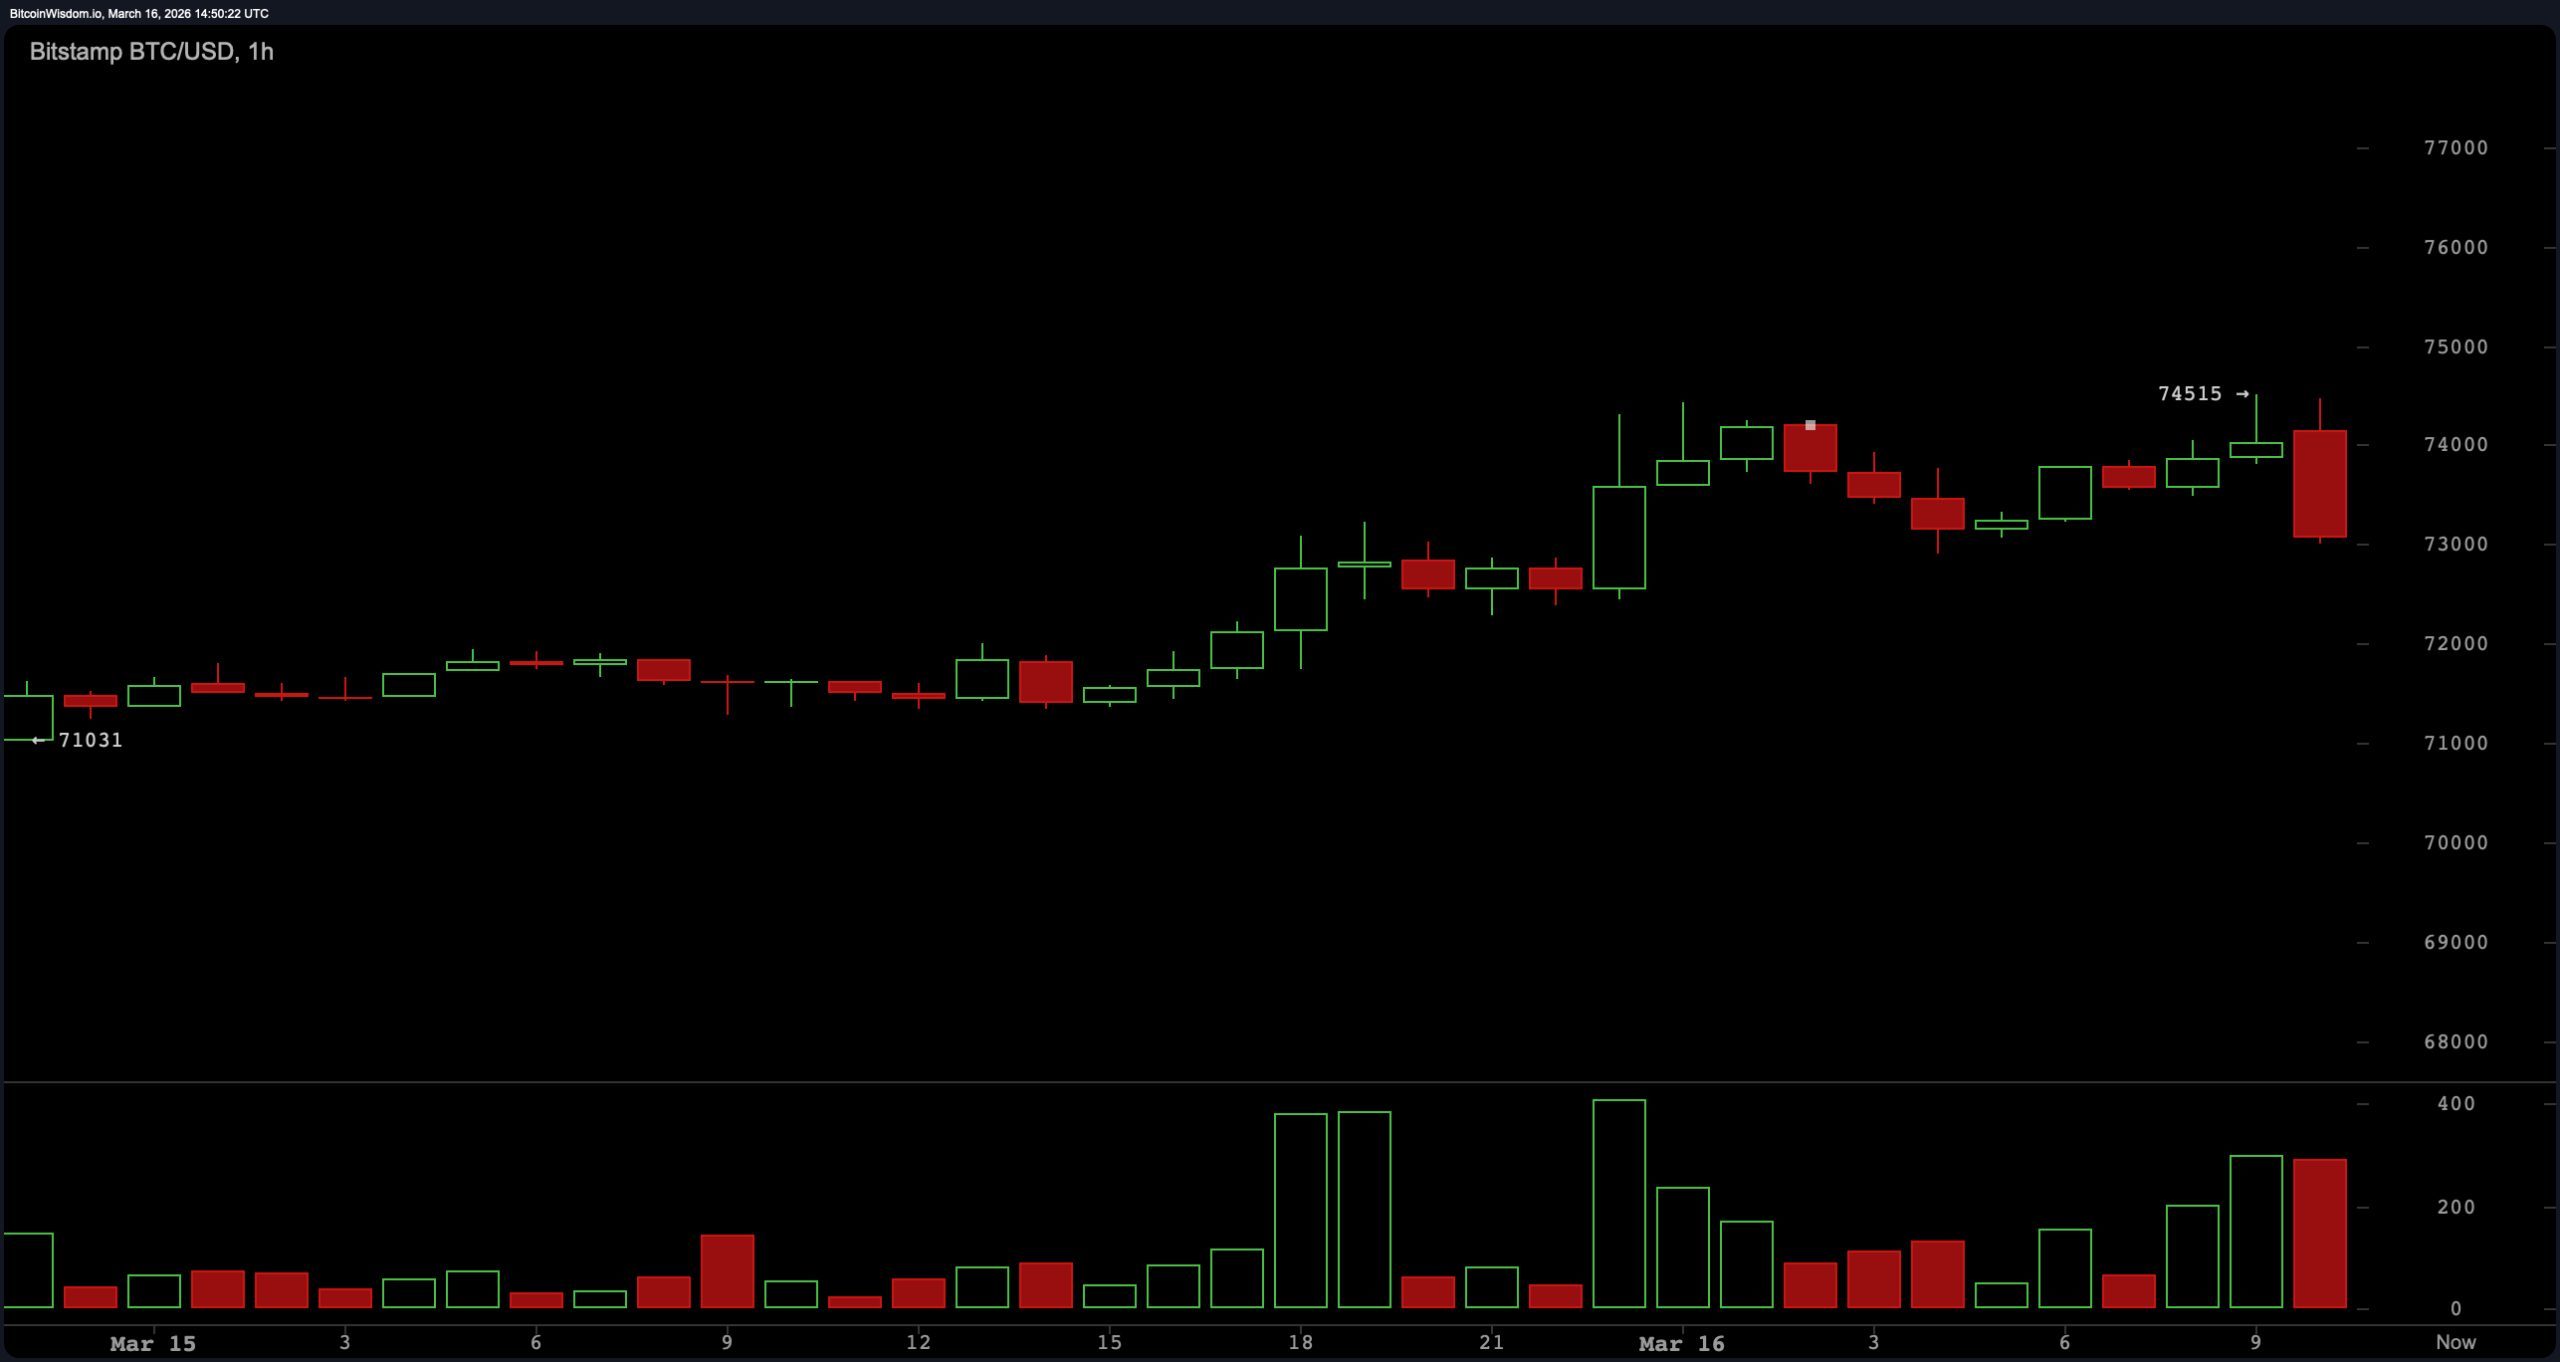
$BTC/USD 1-hour chart via Bitstamp on March 16, 2026.
The oscillator measurements remain nearly neutral overall. The Relative Strength Index (RSI) was recorded as 59, Stochastic Measurement as 80, and Commodity Channel Index (CCI) as 142, each of which was classified as neutral in the dataset. The average directional index (ADX) is 25, which is also labeled as neutral, suggesting only moderate trend strength.
Awesome Oscillator recorded 3,282 and remained neutral as well. Two indicators slightly deviated from the neutral cluster. The momentum indicator (10) recorded 5,076 and the Moving Average Convergence Divergence (MACD) level (12, 26) recorded 364, both indicating positive momentum in the technical summary.
While the moving average provides short-term support, long-term levels remain above the current price. The Exponential Moving Average (EMA) and Simple Moving Average (SMA) show that the EMA (10) is $70,818 and the SMA (10) is $70,054. EMA (20) is $70,012 and SMA (20) is $69,175. EMA (30) is $70,447 and SMA (30) is $68,476. The EMA (50) is $72,799 and the SMA (50) is $71,119.
The long-term averages remain high and include the EMA (100) of $79,412 and SMA (100) of $80,613, as well as the EMA (200) of $87,686 and SMA (200) of $93,738. The overall signal in the data summary remains positive.
Bullish verdict:
Bitcoin continues to hover near the top of its 24-hour range while maintaining distance above several short-term moving averages between roughly $68,000 and $72,000. Momentum indicators such as the Moving Average Convergence Divergence (MACD) and Momentum Indicator (10) are showing positive signals, while the Relative Strength Index (RSI) is below overbought territory at 59. The price is just below the trading high of $74,387.36 and above the 50-period exponential moving average (EMA) of $72,799, with the short-term technical structure reflecting stability near resistance rather than deterioration. If price maintains its position above the cluster of short moving averages, the structure of the chart suggests that the test of the upper bound will continue.
Bear verdict:
Even though Bitcoin is trading near the top of its daily range, it is still below several long-term moving averages that are well above current price levels. The 100-period exponential moving average (EMA) is $79,412, the 100-period simple moving average (SMA) is $80,613, the 200-period EMA is $87,686, and the 200-period SMA is $93,738, all with residual overhead. Oscillators broadly classified as neutral, such as the Relative Strength Index (RSI), Stochastic %K, Commodity Channel Index (CCI), Average Directionality Index (ADX), and Awesome Oscillator, indicate limited trend strength. With the price consolidating just below the session high rather than rising above it, the market continues to trade within a defined range rather than establishing a confirmed breakout.
Frequently asked questions 🔎
- What is the price of Bitcoin on March 16, 2026? bitcoin tradingd March 16, 2026 at approximately 11:15 a.m. EST, near $73,764, 24-hour range $71,389.65 to $74,387.36.
- Is Bitcoin trending up or down now?Short-term charts show that Bitcoin remains above several short-term moving averages and is holding near the top of its daily range.
- What are Bitcoin’s technical indicators showing today?Most oscillators remain neutral, but the momentum and moving average convergence divergence (MACD) indicators show positive momentum signals.
- Which major levels in Bitcoin are traders focused on?The current session high near $74,387 serves as immediate resistance, while nearby support levels appear to be near $73,500, $73,000, and $72,500.