
More than two weeks have passed since the US and Israeli forces attacked Iran on February 28th. The military operation began on Saturday night, when all global markets except for cryptocurrencies were closed. Bitcoin’s initial reaction to the geopolitical shock was a decline of over 7%, confirming all the skeptics’ claims. Critics were quick to point out that Bitcoin continues to show signs of failure when geopolitical events like this occur.
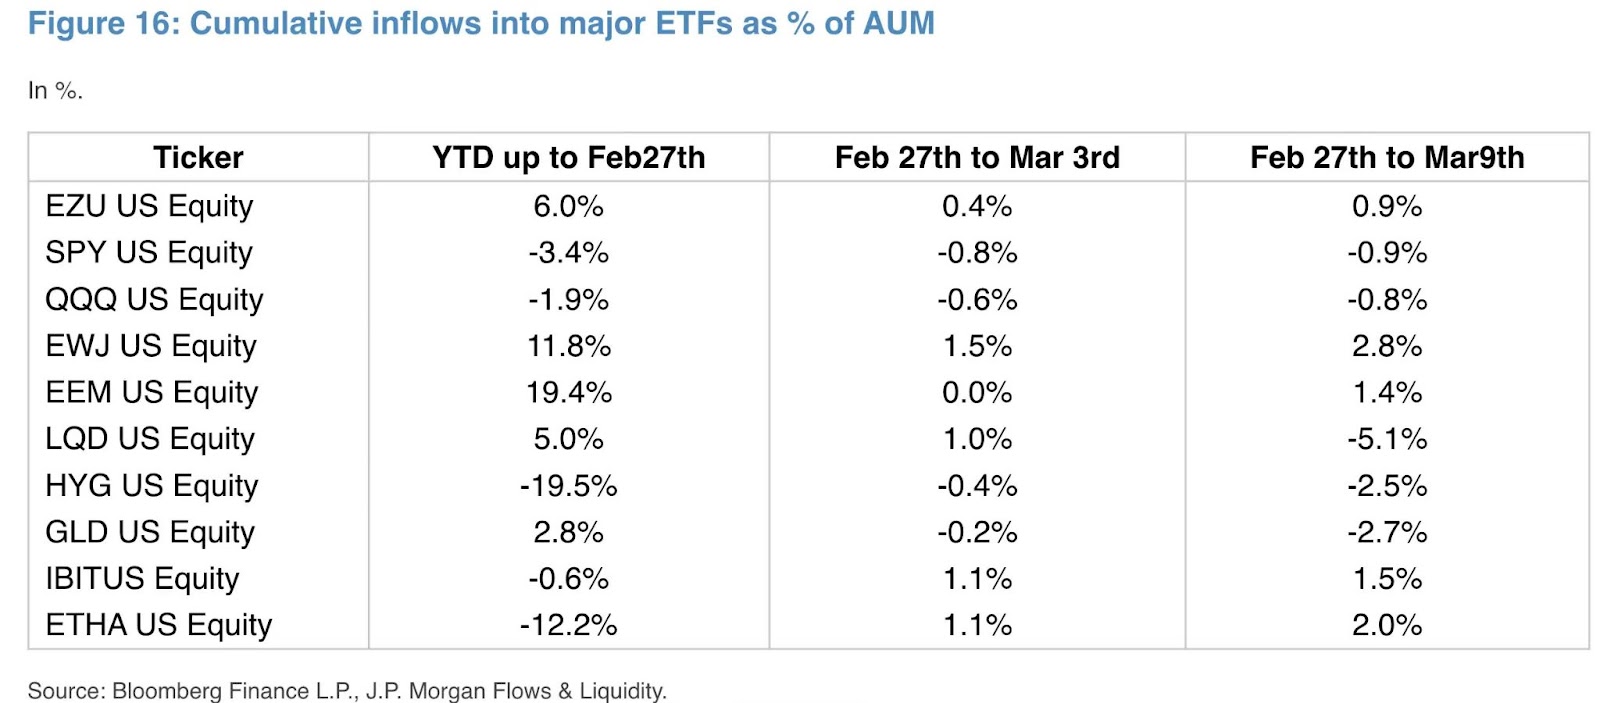
Fast forward to today, and Bitcoin’s performance compared to other traditional markets tells a completely different story. Since the start of the conflict, Bitcoin has risen more than 11%, with more than $230 billion flowing into the cryptocurrency market. In contrast, the S&P 500 is down nearly -3%, the Nasdaq is down about -2%, and even traditional safe-haven assets like gold are down about -5%. Meanwhile, Nikolas Panigirtzoglou, managing director at JPMorgan, emphasized that there is a significant disconnect in the flow of funds between Bitcoin and gold exchange-traded funds. The SPDR Gold Shares ETF (GLD) has seen outflows of about 2.7% of its assets under management, while BlackRock’s iShares Bitcoin Trust has seen inflows of about 1.5% since the war began.
The strength and resilience that Bitcoin has shown so far is prompting investors to reconsider the role of cryptocurrencies in global markets. Rather than acting like “digital gold,” Bitcoin does something the traditional financial system does not: a 24/7 liquidity pool that prices geopolitical risks in real time and brings in institutional investors once traditional markets have finally caught up.
Scoreboard: Bitcoin vs major assets since February 28th

The reality is that Bitcoin has outperformed almost every major asset class since the war began on February 28th. Bitcoin is up more than 11% and is currently trading around $73,000, and at one point reached a high of $74,000, the highest level since February 4th. During the same period, the S&P 500 fell -3%, marking its third straight week of declines. US tech stocks didn’t fare as well, with the Nasdaq down about -2%.
Even traditional safe-haven assets, often seen as the perfect hedge during wartime, failed to deliver positive returns. Gold was down nearly -5%, while silver saw a larger correction of around -11%.
Very similar differences occur in some of the world’s largest markets, particularly in Asia. meanwhile $BTC Cryptocurrencies and cryptocurrencies are gaining momentum, with South Korea’s KOSPI falling more than 9% and Japan’s Nikkei stock average dropping nearly 7.5%. The only major asset that outperformed Bitcoin during this period was oil, but it’s no surprise that the war caused an unprecedented energy supply shock. WTI crude oil has risen more than 34% since the start of the conflict, rising from about $70 to a high of $119.5. WTI crude oil has now returned to near $100 following the Guardian’s report on a strike near Iran’s Kharg Island export hub.
JP Morgan’s ‘Stark Divergence’: Institutional investors’ money is circulating from gold to Bitcoin
New research data from JPMorgan highlights what analysts describe as a “clear disconnect” between investor behavior towards gold and Bitcoin since the escalation began. The report, led by managing director Nicholas Panigirtzoglou, shows that funds are moving in opposite directions between the two asset classes. SPDR Gold Shares (GLD), the world’s largest gold ETF, recorded a 2.7% outflow of assets under management, suggesting that people are indeed pulling money out of traditional geopolitical hedges. Over the same period, BlackRock’s iShares Bitcoin Trust (IBIT) saw inflows of approximately 1.5%. This is a significant departure from the long-standing pattern of gold attracting capital in times of conflict.
The inflow is $BTC Spot ETFs have also seen trend reversals and are institutionally driven. The cumulative net inflows were for five consecutive days, bringing the total inflows since February 28 to approximately $1.34 billion. Before the conflict $BTC Spot ETFs continued to see outflows totaling nearly $1.82 billion in January and February. This is the first time we’ve seen a change in trend since the liquidation cascade on October 10 last year.
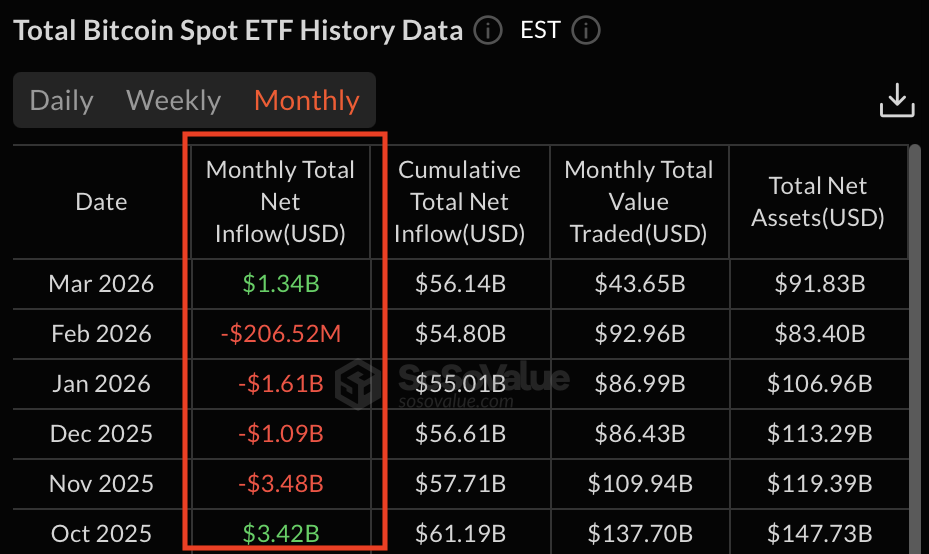
Source: SoSoValue
According to BitBo data, IBIT alone currently holds $57.11 billion worth of Bitcoin, suggesting that these flows are institutional portfolio allocations rather than speculative participation from individual investors. In addition to this, the Fidelity Wise Origin Bitcoin Fund (FBTC) also recorded significant inflows during this period, meaning that two of the world’s largest asset managers are adding to their exposure to Bitcoin during an active geopolitical conflict.
Why Bitcoin is not digital gold: It’s not in the system
The market reaction since the Iran war began also raises questions about one of Bitcoin’s oldest stories. The idea of acting like “digital gold” But under this theory, both asset classes should have risen simultaneously during geopolitical events like this. In fact, the opposite happened. $BTC Gold is both falling and rising, and the capital flows above reflect the same divergence.
During this period, Bitcoin’s structural advantages over traditional safe-haven assets surfaced. Bitcoin trades 24/7, so it was the only major liquidity market open when the preemptive strike took place on Saturday night. This allowed global investors to essentially price in the geopolitical shock immediately, although gold and stock markets remained closed until Monday. After the initial decline, Bitcoin quickly rebounded as ETF market makers and institutional investors stepped in to adjust the gap between the 24/7 spot market and ETF trading windows. The move reflects a broader shift in institutional investor behavior. Regulated investment vehicles such as Bitcoin ETFs are increasingly becoming the preferred gateway for large allocators, with research from State Street Investment Management showing that approximately two-thirds of institutional investors are now considering crypto exposure within their diversified portfolios.
This week’s highlights: FOMC Wildcard
The biggest event likely to determine Bitcoin’s short-term trajectory is this week’s FOMC meeting on March 18th. The US interest rate decision will be announced this Wednesday at 2pm ET, and while the market expects the Fed to keep rates on hold, the updated dot plot and economic forecast summary will be the actual event. This is the first time since the Iran conflict began that the Fed has predicted future interest rate decisions. The bullish case would be if the Fed maintains expectations for one or two rate cuts this year. Conversely, if policymakers change their outlook to avoid lowering rates, Bitcoin could face macro headwinds.
From a technical point of view, Bitcoin is currently trying to break through the important level of $74,000. This is an area that has acted as resistance for the past two weeks, once on March 4th and again on March 13th. On the back of continued ETF inflows and positive news from the Fed midweek, a daily close above this level could set the stage for a breakout.
Oil remains a key wildcard for markets this week as the conflict drags on. There are signs that a cease-fire is in effect and prices fall below $90 per barrel, which could ease stagflation concerns and support risk assets. However, if the turmoil continues and oil prices remain above $100, Bitcoin will be put to the test of whether it can maintain its recent performance during a period of energy-driven inflation.