
Ethereum’s price has fallen more than 35% since the beginning of this year. However, the bullish pattern currently forming on the chart suggests a possible return to previous levels if confirmed.
summary
- Amid macro pressures from geopolitical tensions, inflation risks, and a hawkish outlook from the Federal Reserve, Ethereum remains down more than 35% since the beginning of the year, trading around $2,172.
- A cup-and-handle pattern has formed on the daily chart, and a break above $2,400 could pave the way to $3,000.
- Institutional sentiment is showing signs of early recovery with ETF inflows of $302.8 million this month, but momentum indicators still reflect weak bullish strength.
Ethereum (ETH) price was trading at $2,172 at press time, down 8% from its weekly high and 35.7% from its year-to-date high of $3,379, according to data from crypto.news.
The price of Ethereum has fallen in tandem with Bitcoin (BTC) and the broader crypto market as the macro environment for risk-on assets continues to deteriorate around the world.
Headwinds weighing on investor sentiment include U.S. tariff threats against the European Union and Canada, a series of escalating wars between the U.S. and Iran in the Middle East, and the Federal Reserve’s hawkish stance on interest rate cuts this year.
Investors are also turning to traditional safe-haven assets such as gold and other precious metals for protection from geopolitical instability and inflationary pressures.
You may also like: Why is the crypto market so quiet today?
There have also been outflows from Spot Ethereum ETFs over the past two months, making the market vulnerable to sudden price movements. However, these institutional investors have shown a resurgence this month, with total net inflows to date of $302.8 million, indicating that institutional investors are betting on a recovery at these discount levels.
On the daily chart, Ethereum price has been forming a large cup-and-handle pattern since early February of this year. This pattern is formed with a rounded bottom representing a plateau and a slightly downward-pointing handle representing the final rollout of a weak hand.
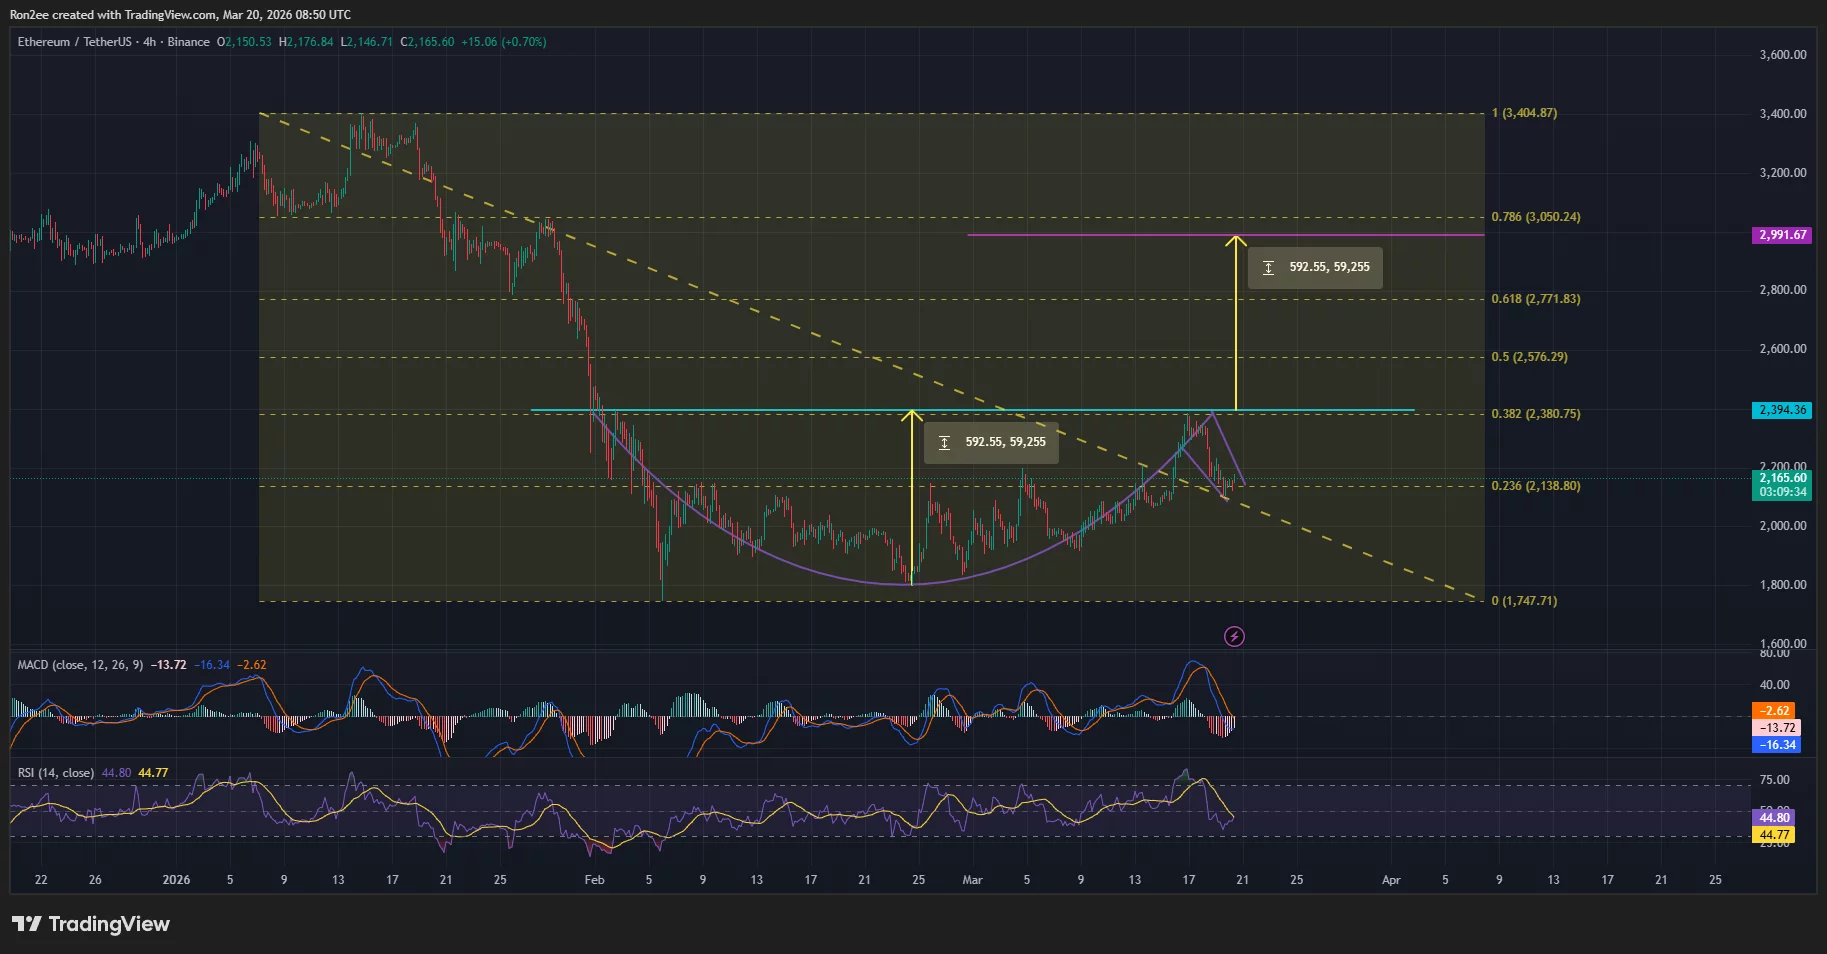
Ethereum price forms cup-and-handle pattern on daily chart — March 20 | Source: crypto.news
The neckline of this pattern is located at the $2,400 psychological resistance level. If there is a decisive breakout here, Ethereum could rise to $3,000. This level is calculated by adding the height of the cup formed at the time the pattern is verified.
Momentum indicators seem to suggest that the bears were still in control of the market at the time of writing. The MACD line is pointing down and the Relative Strength Index is just below the neutral mark at 40.85, but the selling pressure is gone and it is starting to flatten.
For now, the main resistance to watch is the psychological barrier at $2,400, which failed to break during Tuesday’s market-wide rally. On the lower end, $2,000 remains a key support zone and needs to hold to prevent a fall towards year-to-date lows.
read more: Nevada grants permission to seek restraining order against Kalsi
Disclosure: This article does not represent investment advice. The content and materials published on this page are for educational purposes only.