
Bitcoin remained just above $66,000 per coin as of 8:30 a.m. ET on March 28, 2026, trading within a narrow intraday range with momentum fading across multiple time frames. The broader technical structure reinforced the cautious market trend, with prices holding decisively below the major moving averages but near short-term support.
Is Bitcoin about to drop again? $BTC Test Critical $65.5K Support Level
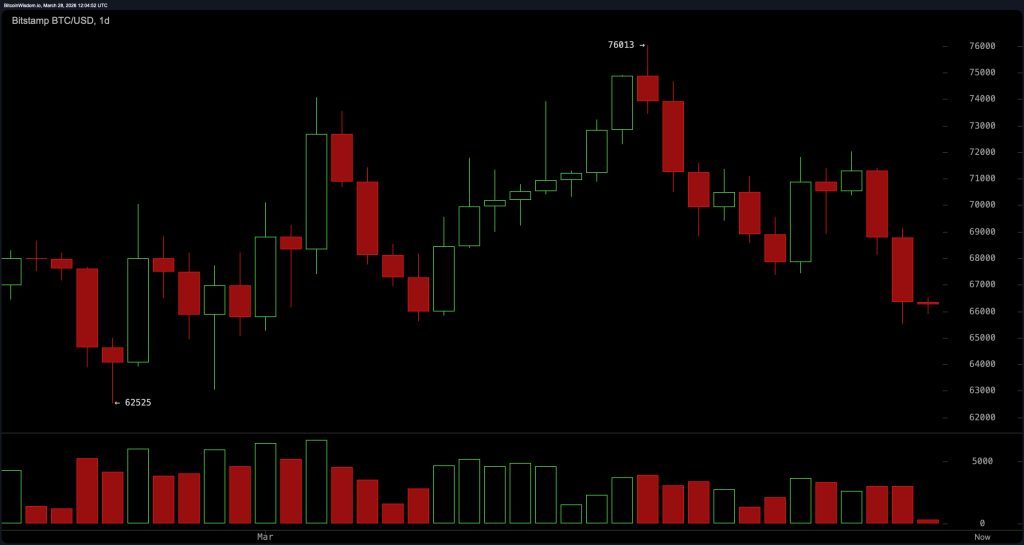
Bitcoin price action on the daily chart reflects the continuation of a broader downtrend following highs near $76,000. The current zone around $66,000 to $67,000 has emerged as interim support, but the inability to regain higher levels highlights persistent weakness.
A break below $65,000 would expose the downside towards $62,000, but there is still resistance between $70,000 and $72,000, leaving Bitcoin in a structurally vulnerable position despite short-term stabilization.
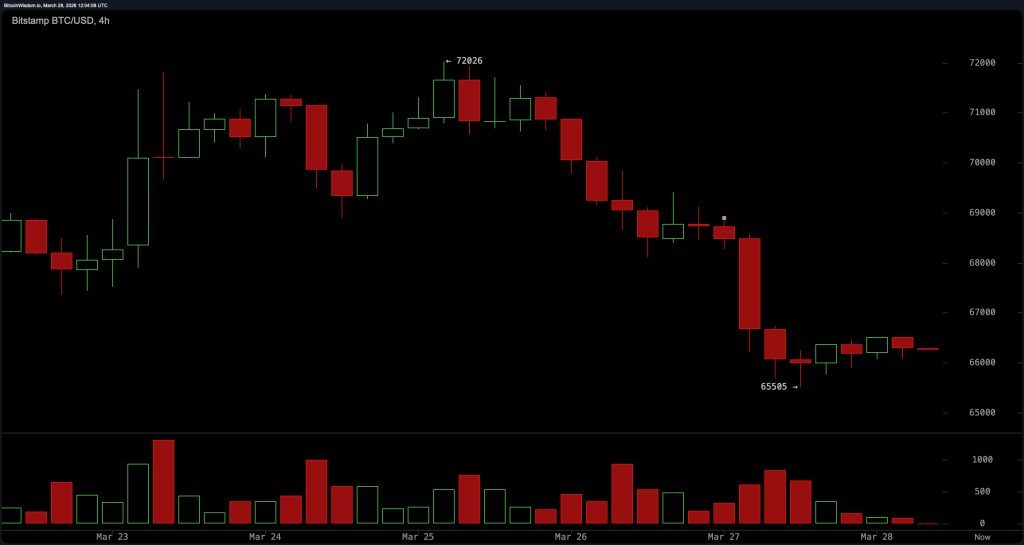
On Bitcoin’s 4-hour chart, the market structure maintains a clear direction, defined by a series of lower highs and sustained selling pressure. After plummeting to around $65,500, the price moved calmly and showed no definitive reversal signals. Price continues to respect the resistance in the $68,000-$69,000 zone, suggesting that any attempt to move higher is being absorbed. This pattern more closely matches continuation behavior than reversal, with no meaningful changes in momentum or volume expansion.
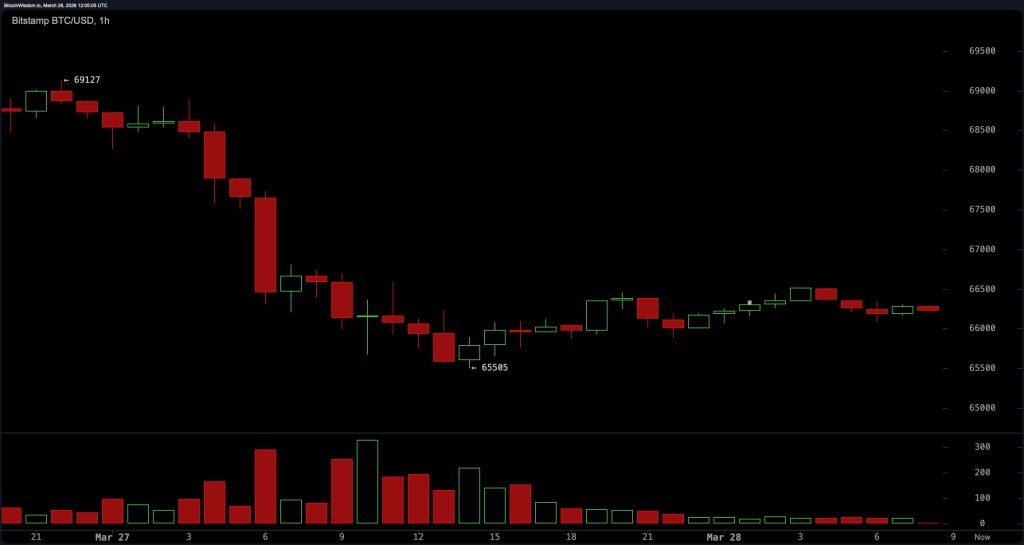
The hourly chart highlights the compression phase, with Bitcoin trading between approximately $65,500 and $66,800. The candlestick body is shrinking and the decreasing volume indicates market indecision. This type of range-bound movement often precedes increased volatility, but the direction remains uncertain. The lack of conviction on either side strengthens the broader narrative. Participants appear to be waiting for a catalyst before committing to a directional move.
The oscillator paints an overall calm image of the mix. The Relative Strength Index (RSI) of 41 shows neutral momentum, while the Stochastic and Commodity Channel Index (CCI) are also still not in solid territory, even though the latter measure is highly negative.
An average directional index (ADX) of 16 indicates a weak trend environment. On the other hand, the Awesome Oscillator and Moving Average Convergence Divergence (MACD) both reflect negative momentum, slightly offset by positive readings on the momentum indicator, giving a neutral but not encouraging summary of the overall oscillator.
Moving averages provide a much less ambiguous signal because the entire structure is tightly overheaded. The Exponential Moving Average (EMA) and Simple Moving Average (SMA) over all major time periods from 10 to 200 days are above the current price, ranging from around $68,923 (EMA 10) and $69,130 (SMA 10) to as high as $85,662 (EMA 200) and $91,308 (SMA 200). This alignment reinforces a strong downward bias in the trend positioning, suggesting that any upward movement will first have to contend with a dense cluster of resistance levels.
Bullish verdict:
Bitcoin maintains an important short-term support zone around $65,500-$66,000, but momentum remains neutral rather than definitively negative. A sustained move above $67,000, especially with increasing volume, would signal a change in short-term structure and open the way to $68,500 and potentially $70,000, challenging the prevailing bearish trend.
Bear verdict:
Bitcoin is still trading below all major moving averages, and the multi-timeframe structure is still defined by falling highs and persistent resistance overhead. A breakdown below $65,500 would confirm the continuation of the current trend and expose downside potential towards $64,000 and $62,000 as weak momentum and overhead supply continue to limit participation on the upside.
Frequently asked questions 🔎
- What is the Bitcoin price outlook on March 28, 2026?Bitcoin is consolidating around $66,000 with a neutral to bearish technical bias across major time frames.
- Why is Bitcoin struggling below $70,000?Bitcoin remains below all major moving averages, indicating strong overhead resistance and weak trend momentum.
- What are Bitcoin’s major support and resistance levels?Support is located near $65,500, while resistance is concentrated between $67,000 and $70,000.
- Could Bitcoin break out or break out next?The current price compression suggests a pending move, and a continuation on the downside is slightly favored unless the resistance breaks.