
Ethereum continues to show signs of resilience as price action stabilizes around $2,130, with traders closely watching to see if the recent rally develops into a broader breakout. The 4-hour chart reveals that the market is attempting to move from indecision to a more structural upswing.
Despite continued volatility, recent activity above major moving averages suggests improving sentiment. As a result, market participants are now focused on whether this momentum can sustain above key support levels.
Short-term structure becomes constructive
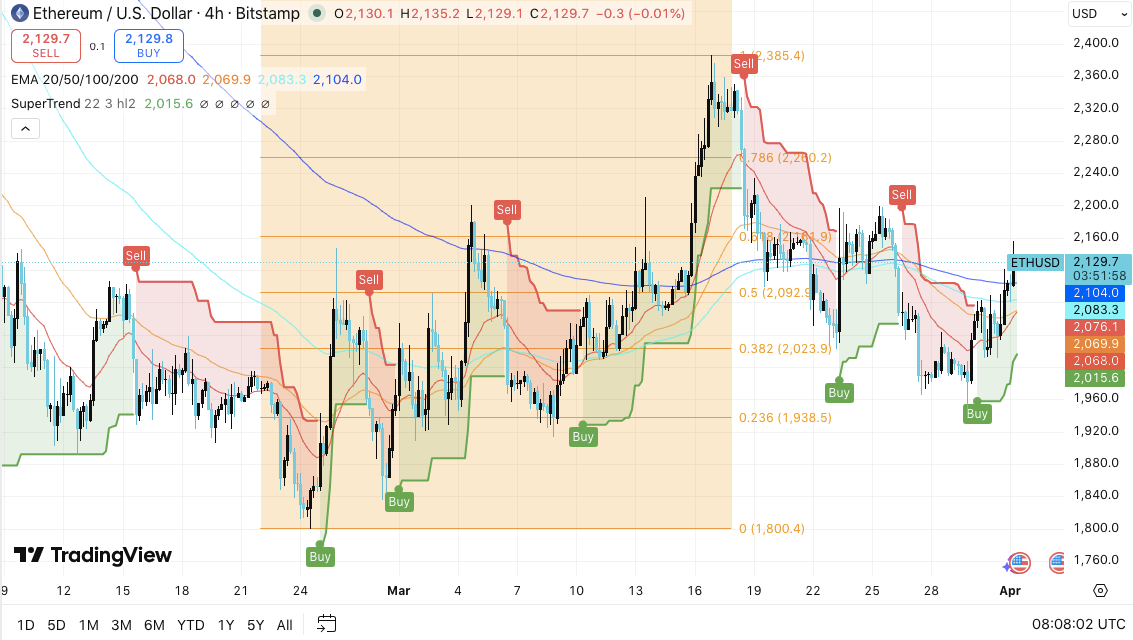
In recent trading, the price trend has changed markedly. Previously, Ethereum went through an unstable and range-limited phase filled with failed breakouts. However, the current structure has higher lows forming, indicating increased buyer control. Additionally, price has retraced the 20, 50, 100, and 200 EMAs, reinforcing the short-term bullish bias.
The recent reversal of SuperTrend to green further confirms this transition. Moreover, the momentum reflects a recovery phase following a corrective pullback.
This pattern often appears before a continuation move in a trending environment. However, the broader structure still reflects consolidation unless price clears the higher resistance zone.
Key levels that define the battlefield
The $2,090 level stands as the most important pivot in the current setup. Price stability above this zone favors continued upward attempts. Additionally, this area coincides with an important Fibonacci retracement level and previous reaction zone, increasing its importance.
Related: Cardano Price Prediction April 2026: Can ADA Break Above $0.28 As Banks Choose Midnight Over Ethereum And Solana?
On the upside, immediate resistance lies between $2,160 and $2,180. A break above this band could pave the way to $2,220 or even $2,350. Importantly, that higher range marks the height of the previous swing and becomes the definitive breakout zone.
Conversely, a loss of $2,090 would weaken the bullish trend. In that scenario, the price could revisit $2,020 and perhaps stretch towards $1,940. Therefore, traders will continue to treat this level as a decision point.
Market data suggests maturing of participation
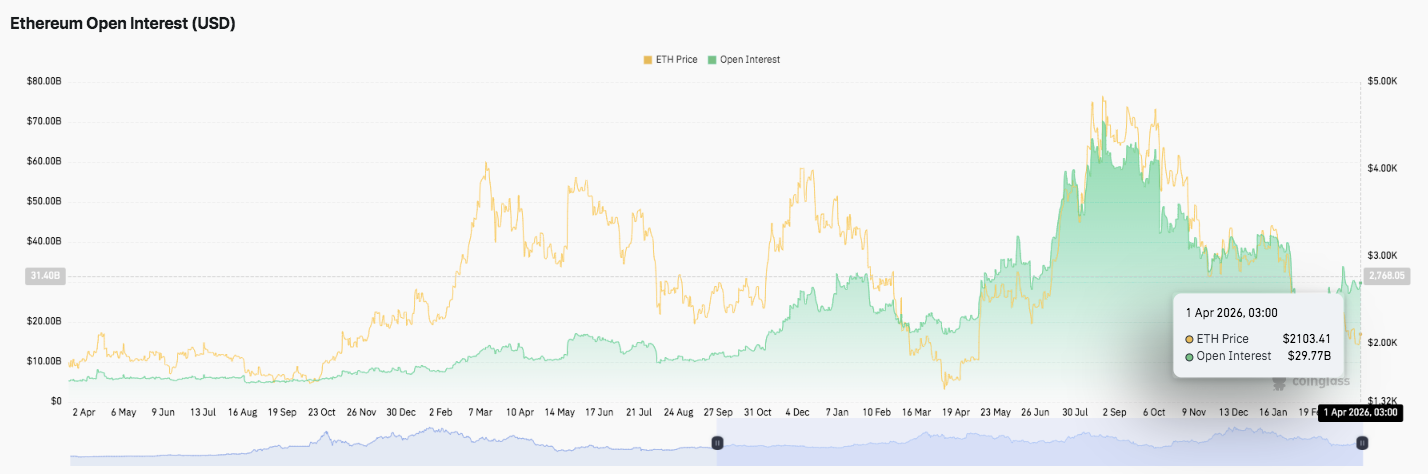
Beyond price trends, derivatives data highlights a maturing market structure. Open interest has expanded cyclically, peaking above $50 billion and then declining toward $30 billion. This trend reflects continued participation even during the cooling phase.
Furthermore, each rally increased leverage, while the economic downturn caused a rapid unwinding. This move suggests a more sensitive and liquid market environment. Additionally, a high baseline in open interest indicates stronger institutional investor involvement over time.
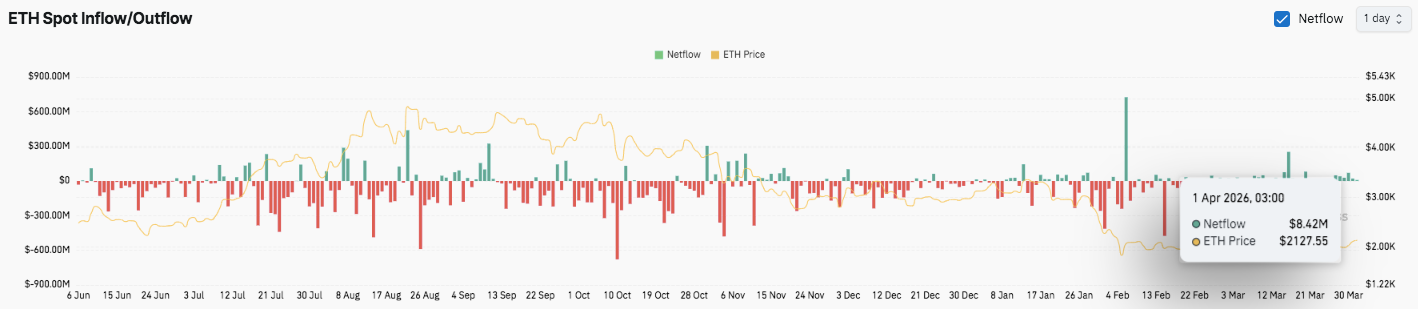
Spot flow data adds a new layer of insight. We saw sustained outflows early on, indicating selling pressure. However, recent data reveals a more balanced flow with intermittent inflows. This shift therefore suggests cautious optimism rather than positivity.
Ethereum technical outlook
Ethereum trades near key inflection points, so key levels remain well-defined. Market structure reflects the progress of the recovery, but its confirmation depends on how prices react around nearby resistance and support clusters.
Top level: $2,160 to $2,180 is still the first barrier. A break above this zone could push the price towards $2,220 and $2,280. Furthermore, if the strength holds, it could begin a move towards significant highs between $2,350 and $2,380.
Related: Algorand Price Prediction: ALGO Price Up 18% if Bullseye Above $0.10
Lower price level: $2,090 serves as immediate trend support and an important pivot. Below this, the price could return to $2,020-2,040, and if selling pressure increases, it could return to $1,930-1,950. These zones represent areas of strong structural demand.
Upper limit of resistance: The $2,200 to $2,230 region serves as the supply zone and advance breakdown area. A decisive move above this would strengthen the bullish outlook over the medium term.
The current technical setup suggests that Ethereum is compressing within the consolidation range after the recovery phase. Additionally, price moving above the major moving averages indicates that momentum is improving. However, a clear breakout is still required to confirm market continuation.
Will Ethereum rise further?
Ethereum’s near-term outlook is largely dependent on holding the $2,090 level as support. If buyers defend this zone, the price could gain momentum towards the $2,180 resistance cluster. As a result, the breakout could trigger further upside toward $2,280 and potentially $2,350.
Additionally, improving open interest trends suggest continued market participation and often support directional moves. The stabilization of spot flows also indicates balanced sentiment rather than aggressive selling pressure.
However, if the price cannot sustain $2,090, the bullish structure will weaken. If that happens, Ethereum could return to a deeper downside with downside targets at $2,020 and $1,940.
For now, Ethereum remains at a decisive level. The structure is cautiously bullish, but confirmation depends on the strength of the breakout and continued commitment from buyers.
Related: Dogecoin Price Prediction: Can DOGE finally break above $0.10 in April after 6 weeks of failure?