
Ethereum is back in the zone where two separate charts treat it as a baseline rather than the end of a cycle. One setup focuses on support between $1,800 and $1,400, and the other shows a long-term accumulation structure that could form the next big breakout.
Ethereum tests accumulation zone as $4,700 breakout level as chart map
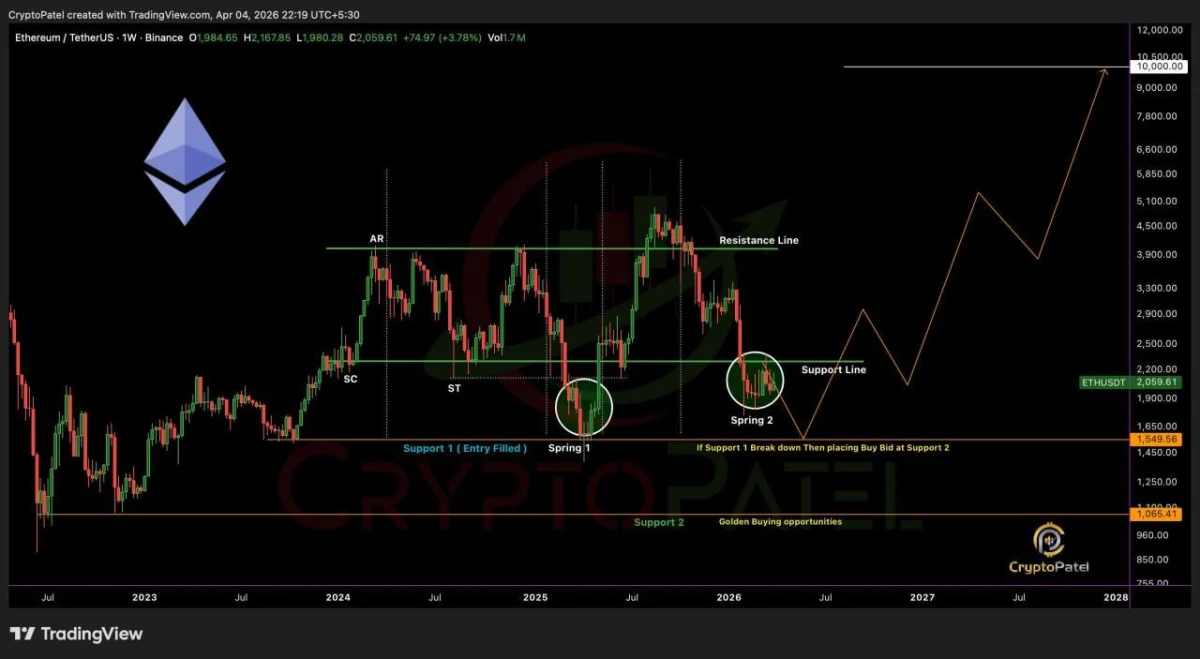
Charts shared by Crypto Patel Presents Ethereum This is because it is within the range of possible accumulation after a sharp decline from higher levels. On the weekly chart, $ETH The marked support line remained close to the current price range and was trading around $2,059.61. The chart labels this region as Spring 2, suggesting a second retest zone after an earlier washout marked as Spring 1.
Ethereum accumulation map. Source: Krypto Patel
The structure on the chart shows two major areas of support. The first support zone is around $1,800 to $1,400, which the post describes as the best buying range. Deeper fallback support, marked Support 2, appears near $1,065.41. In other words, the chart treats the current region as important, but also leaves room for another drop if the initial support fails.
On the upside, the key line to watch is around $4,700, which is marked on the chart as a major resistance and breakout level. This area was at the upper end of prices during the initial bull market and is currently at that level. $ETH Perhaps a recovery is needed before a larger bullish continuation becomes more convincing. Until then, the chart shows accumulation logic rather than a breakout confirmation.
The post also predicts long-term upside targets of $10,000, $15,000, and $20,000. However, these levels are presented as scenario paths rather than results supported by current price trends alone. At the moment, the stronger message from the chart is that Ethereum is trying to stabilize in its historical support area after a significant drawdown.
So the setup is clear. if $ETH If it holds the current support band and starts building higher lows, traders may start to focus on a move towards the resistance line and eventually the $4,700 breakout area. However, if we break out of this zone, the chart suggests that the next major point of interest could be a move down towards a deeper support area around $1,065.
Ethereum’s extended accumulation pattern points to higher cycle targets
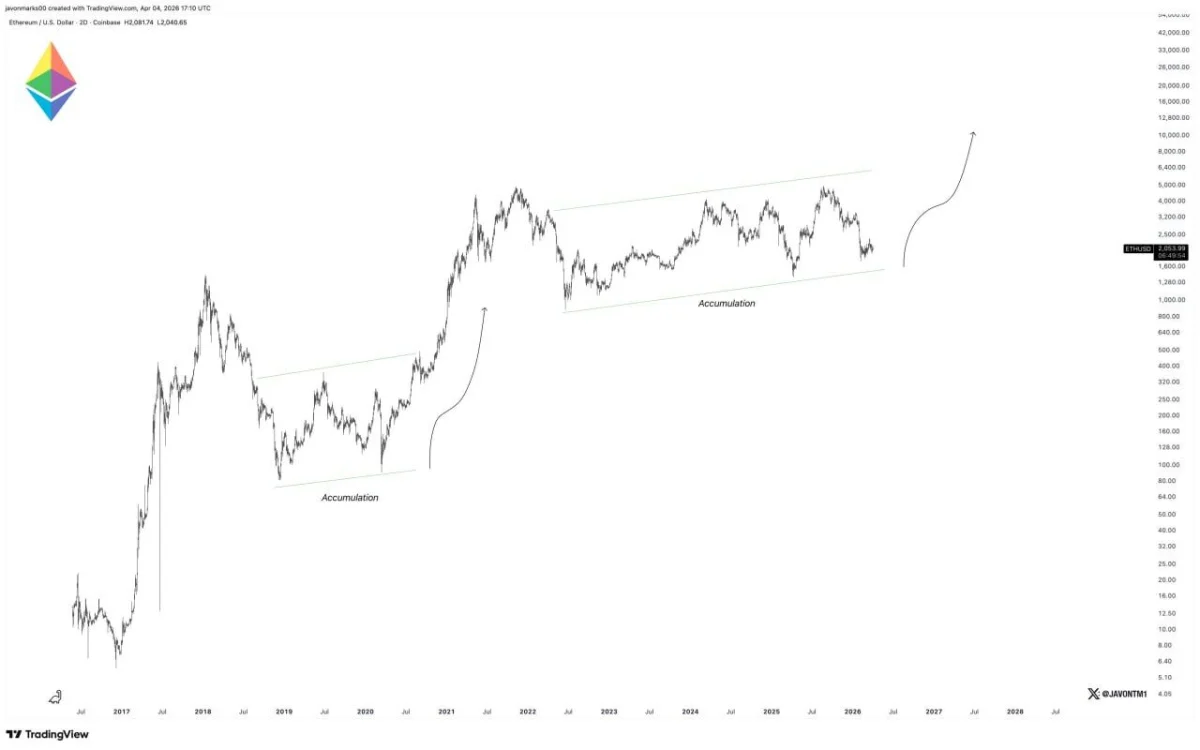
A chart shared by Javon Marks claims that Ethereum may still be going through a long accumulation phase similar to the early cycle structure. This setup compares the historical accumulation channel to the current channel and suggests that even a prolonged sideways range can lead to a strong subsequent rally. In both cases, the charts show that the price is in an ascending channel for an extended period before the expected breakout.
Ethereum’s extended accumulation pattern. sauce: Javon Marks
The comparison is important because the previous structure ended with a sharp bullish move after the consolidation. Here, the current channel is again labeled as cumulative, and the curve projection on the right suggests that analysts expect it to follow a similar breakout path. In other words, the core idea of the chart is based on repeating patterns rather than short-term triggers.
The upper and lower trend lines of the current structure constitute a broad trading range that has kept prices down for an extended period of time. This usually indicates that the market is still building a foundation, rather than trending cleanly in one direction. As long as that structure is in place, the cumulative argument remains valid.
The same post also points to $8,500 and $12,000 as the next major targets if the pattern resolves to the upside. These targets are stated as cycle targets rather than short-term resistance levels. Therefore, the chart presents a longer-term theory that depends on whether Ethereum completes this foundation first and then breaks out strongly.
At the same time, the chart does not prove that the breakout will occur on the same timeline as the previous cycle. It just shows that the current structures share a similar shape. So the main takeaway is simple. If this cumulative range holds and eventually breaks further above, the chart suggests that Ethereum could move into an even bigger expansion phase with $8,500 and $12,000 as the next upside targets.