
Bitcoin was trading at $71,587 on Sunday morning, with a market capitalization of $1.43 trillion, 24-hour trading volume of $28.39 billion, and an intraday range of $71,484 to $73,720. The price drop followed comments from US Vice President J.D. Vance, who revealed that the US had failed to reach an agreement with Iran during peace talks with Pakistan. Technical conditions remain neutral across the board as near-term resilience counters stubborn higher timeframe resistance in a market where the next move seems undecided.
Important points:
- As of April 12, 2026, 7:30 AM ET, Bitcoin holds $71,587. Movement within a range indicates the strength of a weak trend.
- TradingView data shows RSI 56, ADX 16. Neutral momentum limits breakout confidence.
- Bitcoin is facing resistance near $73.5 million. A break above $74,000 or below $70,000 will determine the next move.
Bitcoin chart outlook
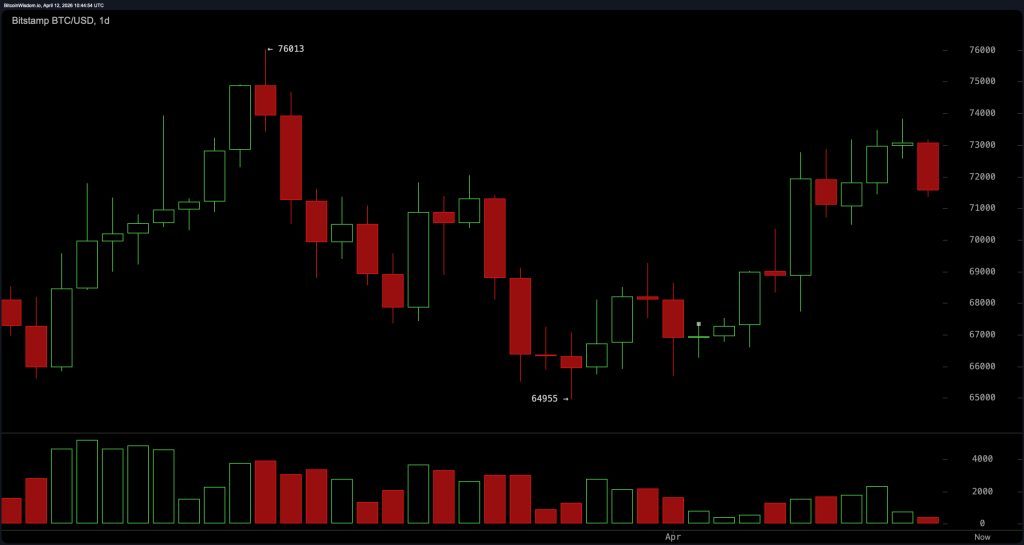
On the daily time frame, Bitcoin continues to trade within a clear range between approximately $65,000 and $76,000, with current price action uncomfortably close to the upper bound. Sitting around $72,000 to $73,000, the price is toying with resistance rather than building a convincing breakout structure.
After the bounce from $65,000, momentum has slowed significantly, suggesting that the bullish energy is running out of steam. This positioning puts Bitcoin in a less-than-ideal position, with upside limited nearby while meaningful support remains a few thousand dollars lower.
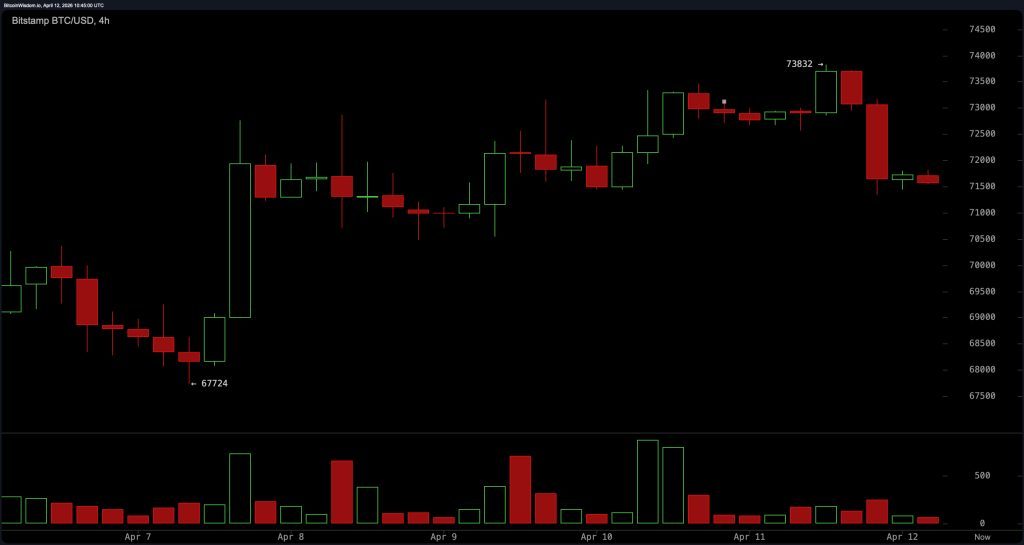
The 4-hour chart introduces a more cautious tone, highlighted by a sharp rejection near $73,720 that created a strong bearish candlestick. Since then, the price structure has shifted to a lower-high pattern, indicating short-term weakness entering the market. Resistance is currently well defined between $72,500 and $73,500, with support between $70,500 and $71,000. A break below $70,000 could increase downside momentum. For now, Bitcoin appears to be going through a correction phase rather than building sustained directional strength.
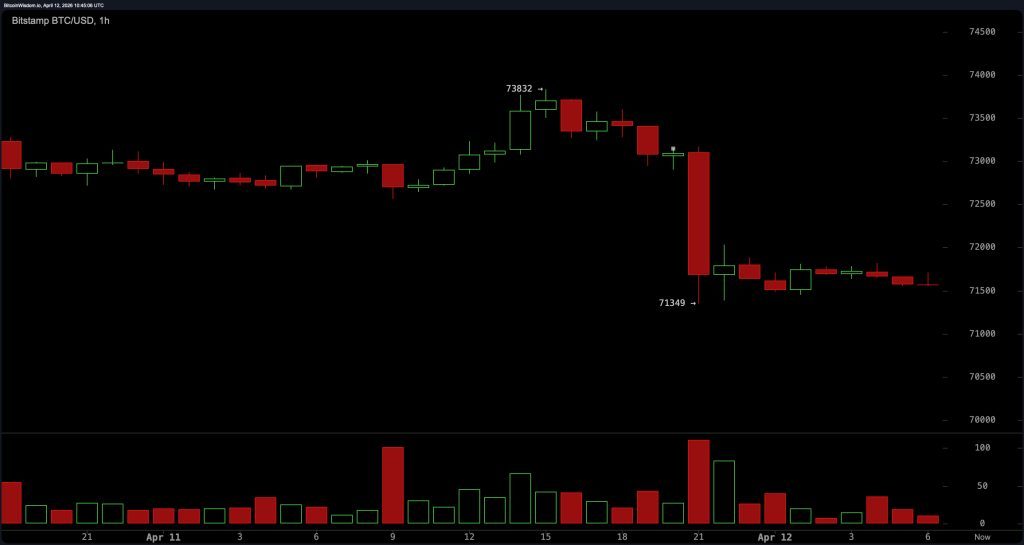
On the hourly time frame, Bitcoin fell sharply before settling into a narrow consolidation around $71,500. The subsequent rebound was significantly weaker, reflecting the lack of active participation by buyers. Intraday resistance is seen between $72,000 and $72,500, while support lies near $71,300 and continues through $70,500. Action within the range suggests equilibrium, but it does not inspire confidence and is more like a stalemate than a preparation for a decisive move.
The oscillator reinforces the broader theme of indecision, and the overall overview remains neutral. A relative strength index (RSI) of 56 reflects a balanced condition, while a stochastic of 86 indicates that the region is too spread out.
The Commodity Channel Index (CCI) of 94 is still rising but neutral, and the Average Directional Index (ADX) of 16 confirms the strength of the bearish trend. The Awesome oscillator at 2,351 remains neutral, while the Momentum (10) at 4,679 shows a decrease in strength. A moving average convergence divergence (MACD) (12, 26) level of 708 provides a rare constructive signal, but is somewhat isolated in an otherwise mixed field.
The moving average (MA) overview is also in neutral territory, but when you look at the details, there is a clear division of opinion. Short-term indicators are supporting the exponential moving average (EMA) (10) at $70,922, simple moving average (SMA) (10) at $70,456 below the current price, EMA (20) at $70,102 and SMA (20) at $69,186. EMA (30) of $69,953 and SMA (30) of $69,864, EMA (50) of $70,751 and SMA (50) of $69,170 reinforce this constructive undertone. However, the long-term picture is less forgiving, with the EMA (100) at $75,326 and SMA (100) above the price by $75,466, followed by the EMA (200) at $83,405 and SMA (200) at $87,873. Simply put, Bitcoin has maintained short-term ground, but is still staring at a fairly large ceiling.
Bullish verdict:
If Bitcoin manages to regain and maintain the $73,500-$74,000 area, the recent series of high declines will be nullified and upward momentum will be re-established on the lower time frame. Coupled with supportive short-term moving averages and a constructive moving average convergence divergence (MACD), these moves could quickly shift sentiment and pave the way for a retest of the upper end of the broader range near $76,000. In that scenario, this market would stop hesitating and start acting as if it had remembered its reputation.
Bear verdict:
Failure to sustain the $70,500 to $71,000 support zone, especially a decisive break below $70,000, would confirm downside pressure increasing over multiple time frames. With weak momentum, high stochastic %K, and the long-term moving average acting as overhead resistance, the path of least resistance could tip downward toward the $69,000 to $70,000 area. At that point, Bitcoin will no longer be indecisive and will simply give up ground one support level at a time.