
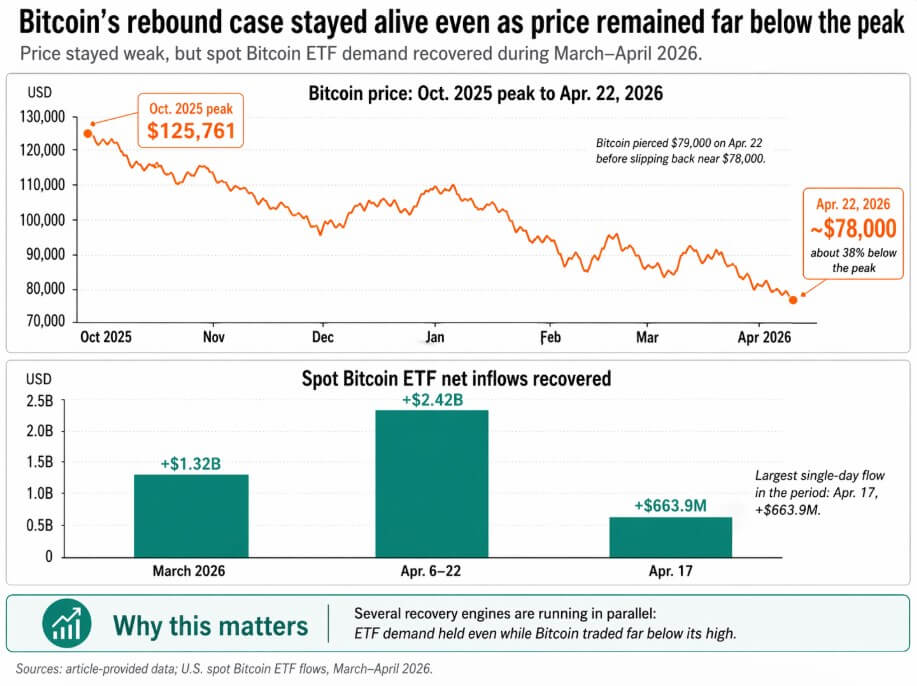
Multiple recovery engines are running in parallel as Bitcoin trades around $78,000, about 38% below its October 2025 peak.
The US Spot Bitcoin ETF received $1.32 billion in inflows in March, reversing a streak of outflows that lasted from November 2025 to February 2025. An additional $2.42 billion was added net from April 6 to April 22, with the largest inflow of $663.9 million recorded on April 17.
Demand held up, but the Nasdaq 100 index fell 4.9% from the first quarter, and the S&P 500 index fell 5.1%. On April 22nd, Bitcoin breached $79,000, but fell again to $78,000.
Weekly inflows into global equity funds were the biggest since late March as war risks receded.

Anthony Scaramucci argues that the cycle scenario remains intact as long-time holders sell their strength, the timing is off, and a cleaner recovery period opens in late 2026.
In an interview with Reuters earlier this year, he said the direction was still pointing towards $125,000-$150,000.
3 engines in operation
JPMorgan’s public position is that the flow of financial institutions is driving the rebound, and that the buyer base has deeper pockets and is more rule-based.
Coinbase and EY-Parthenon’s 2026 Institutional Survey found that 73% of respondents plan to increase their digital asset allocation this year, 66% already have access to spot crypto through an ETF or ETP, and 81% prefer spot exposure through registered vehicles.
The study concluded that volatility is creating more formal risk discipline.
On January 5, Bank of America began recommending cryptocurrency ETPs to Merrill, Merrill Edge, and private bank advisors.
Morgan Stanley applied for a Bitcoin ETF in January and launched MSBT on April 8th. Goldman Sachs filed for its first Bitcoin ETF product on April 14th.
In Hong Kong, the establishment of Bitfire and Avenir is expected to draw more than 10,000 BTC into regulated Bitcoin-denominated strategies, with Avenir already holding $908 million in IBIT.
Each move routes more Bitcoin demand through channels that are slower to execute due to compliance structures, position sizing rules, and client agreement constraints.
| recovery engine | Key evidence in the article | Why do bulls think it’s important? |
|---|---|---|
| System flow | JPMorgan says financial institutions will encourage a rebound. EY/Coinbase survey shows 73% plan to increase allocation | Deep-pocketed, rule-based buyers may be less responsive than retailers |
| access infrastructure | BofA has opened access to advisors. Morgan Stanley launched MSBT. Goldman submitted. Hong Kong strategy aims for 10,000 BTC or more | Buy more through regulated and scalable channels |
| Technology/market structure | Bernstein said his goal of $150,000 is the bottom. Bespoke expects $85,000 breakout in next test | Recovery could gain momentum even without a single perfect macrocatalyst |
Bernstein said in March that Bitcoin had bottomed out and would maintain its year-end target of $150,000. Bespoke argued that Bitcoin has emerged from a six-month decline and the next big test will be around $85,000.
Combined, we can see that the chart-based bullish case holds regardless of whether macro and regulatory catalysts arrive on time.
In the past, the post-halving template organized the entire conversation into drawdowns, accumulations, and late-cycle euphoria. Scaramucci believes this order will continue, while the market has outgrown that single framework.
ETF wrapper movement, advisor channel depth, institutional research data, and short-term technical data all create independent arguments for a recovery.
Two possible outcomes
The bullish rationale rests on continued expansion of the institutional channel, sustained ETF inflows, easing of geopolitical stress, and markets starting to price in cleaner regulatory and liquidity conditions.
Mr. Scaramucci’s stated desire, Mr. Bernstein’s $150,000 target and Citi’s $165,000 bull market are all pegged at the $125,000 to $165,000 range.
The recovery in flows, the gradual contraction of ETF holdings of BTC during the drawdown, the speed of the recovery in inflows in April, and the documented expansion of access to banks and brokerages in the first four months of 2026 all point in that direction.
The bearish case is constrained by conditions that recent drawdowns have not fully tested.
Citi lowered its 12-month Bitcoin target from $143,000 to $112,000, saying Bitcoin could rise to $58,000 on the back of the recession, and identified a key level representing the pre-election price range at around $70,000.
Standard Chartered believes Bitcoin could fall towards $50,000 before recovering by the end of the year, with the end-2026 target lowered to $100,000.
The market depth has shrunk from more than $8 million in 2025 to around $5 million, and the options market has seen strong demand for downside protection in the $50,000 to $60,000 region. Kuma’s case has also experienced redistributive and legislative deadlock.
Citi explicitly linked the downside scenario to the US crypto bill impasse, thereby depleting a key catalyst for ETF demand.
If model portfolios face widespread redemption demand, the same rebalancing rules that led to restraint in March and April could accelerate selling, including stop-loss triggers, allocation bands that force forced cuts, and concurrent margin calls.
A more disciplined set of ETF buyers may simply push Bitcoin volatility onto leveraged traders, perpetual futures markets, miners, and corporate treasury holders who operate without guardrail rebalancing.
Standard Chartered’s $50,000 flash scenario envisions both a rebound by the end of the year and a more severe intermediate path. Recovery camps may be right about the destination and wrong about the route.
| scenario | what supports it | Key price levels/signals | what would confirm that? |
|---|---|---|---|
| bull case | ETF inflows will be sustained, institutional access will expand, geopolitical stresses will ease, and liquidity and regulation will improve. | $125,000 – $165,000 Ranging from Scaramucci to Bernstein to Siti Bull Case | BTC held by the ETF remains resilient, with flows quickly stabilizing during downturns |
| bear case | Recession risk, US legislative impasse, weak liquidity, downside hedging, forced rebalancing | $112,000 city base, $70,000 key zone, $58,000 The negative side of the city $50,000 Stan Chart Flash Risk | ETF flow suddenly reverses, deeper drawdown triggers forced sell-off |
| key test | Next 20% to 30% drawdown | Flow behavior and ETF holdings BTC | Will the April-type stabilization be repeated or will it collapse? |
Bitcoin’s next 20%-30% drawdown will settle this debate.
If BTC held by ETFs shrinks sharply and reverses, the recent resilience could be read as a pause typical of the macro conditions of March and April.
When flows stabilize quickly, as they did in April, the hypothesis that the selling came from long-term holders while ETF buyers held back begins to solidify as a documented market fact.
Prospects for recovery into 2026 are alive, the buyer base is becoming more institutionalized, and access infrastructure continues to deepen, regardless of price.
(Tag translation) Bitcoin