
Bitcoin was trading near $80,901 just after 8:00 a.m. ET on May 10, 2026, maintaining a broadly bullish market structure across the daily, 4-hour, and 1-hour charts. With price action caught between stubborn resistance and resilient support, traders are noticing that Bitcoin is behaving like a caffeinated cat pacing near a closed door, clearly planning its next move.
Important points:
- Bitcoin crossed $80,000 on May 10, 2026 and maintained a bullish high-low structure.
- The chart data showed 12 positive moving average (MA) signals. $BTC It approached the $811,000 resistance level.
- Market data shows a volume of $17.7 billion, and traders are waiting to see if Bitcoin breaks out towards $84,000.
Bitcoin chart outlook
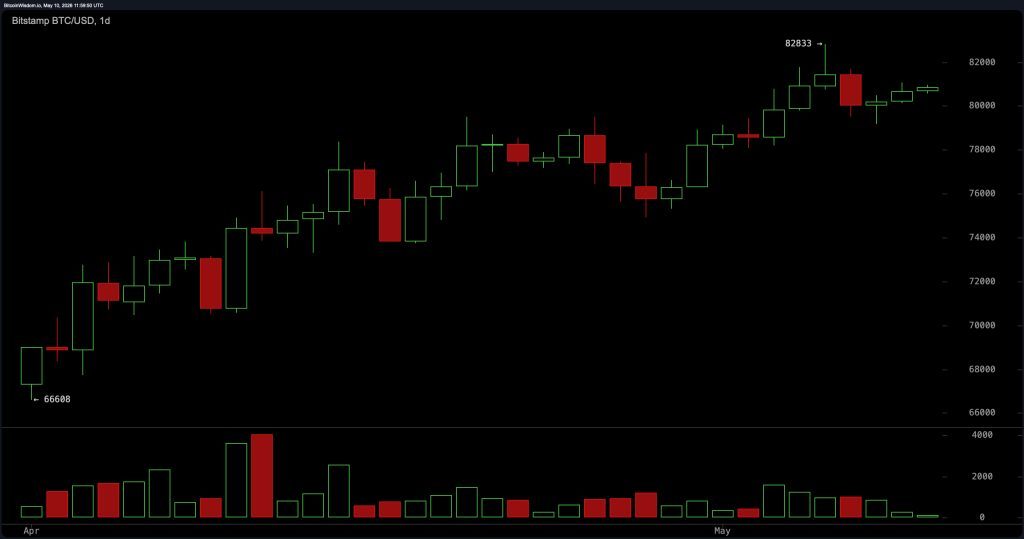
The daily chart continues to support upside as Bitcoin maintains its high-low pattern, a structure that technical traders typically associate with sustained strength. $BTC It recently faced rejection near the $82,800 resistance level but was unable to generate meaningful follow-through due to downside pressure. This is important because weak bearish momentum after a rejection often indicates that buyers remain active behind the scenes.
Support between $79,500 and $80,000 remains firmly held, constructively holding the broader trend despite some short-term hesitation. Its market capitalization remains huge at approximately $1.62 trillion, reinforcing Bitcoin’s dominant position in the digital asset field. Even after years of volatility tantrums, Bitcoin still refuses to behave in its time.
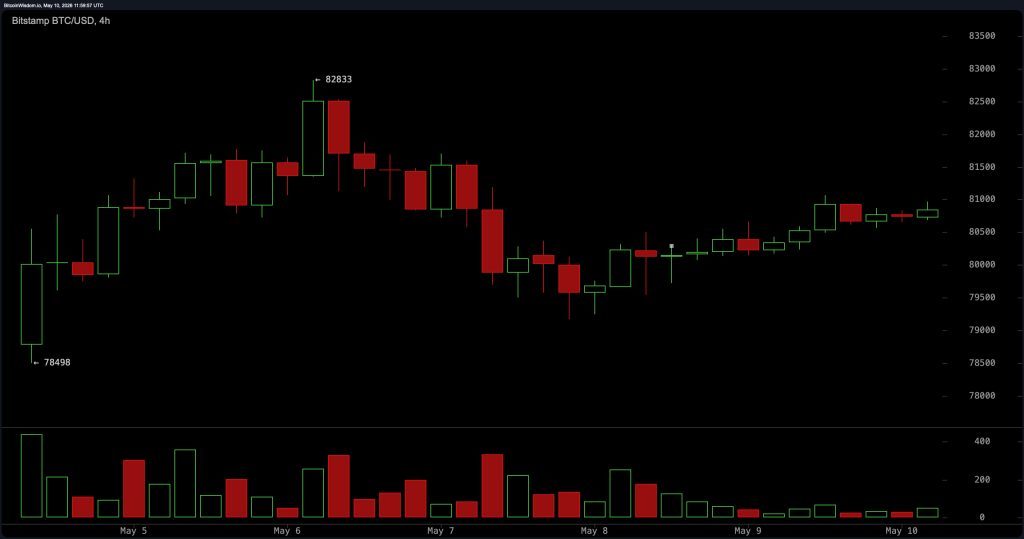
The 4-hour chart depicts a consolidation in Bitcoin’s recent rally. Price action remains compressed between approximately $79,500 and $81,000, but lower volume and lower volatility suggest a classic compression phase. In technical analysis, such periods often precede an expansion in an aggressive direction when the price breaks out of a range. Traders are closely monitoring the $81,100 level as a potential breakout trigger, but failure to sustain support near $79,500 could dampen near-term sentiment. Until one side gains definitive control, Bitcoin will appear to be grinding away sideways, like a hedge fund manager avoiding direct questions on live television.
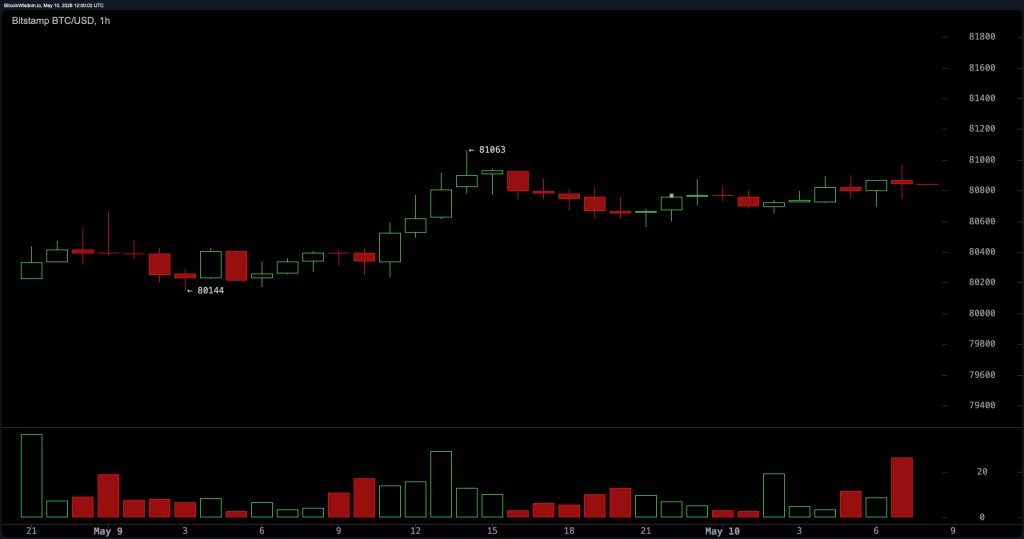
On the hourly chart, Bitcoin continues to exhibit neutral to bullish momentum characteristics with gradual gains and shallow pullbacks. Buyers are consistently defending the decline between $80,400 and $80,600, preventing a deeper retracement from developing. Importantly, market data does not indicate an aggressive downside.Accumulation behavior of sts rather than widespread dispersion. The intraday price range of $80,254 to $81,023 also reflects relatively stable participation despite broad macro uncertainty. The short-term momentum may not be explosive, but Bitcoin continues to rise due to the stubborn persistence of someone who pretends to be “long-term” and updates their portfolio every 7 seconds.
Currently, oscillators offer different technical backgrounds, but are generally stable. The Relative Strength Index (RSI) reading of 65 is still in neutral territory, indicating that Bitcoin is not entering overheating territory and is approaching a stronger momentum state. The Stochastic Index this morning was 72, also remaining neutral, while the Commodity Channel Index (CCI) was 106, reflecting weak short-term momentum.
The average directional index (ADX) value of 31 suggests that the current trend remains moderately strong. Meanwhile, Awesome Oscillator recorded a neutral signal at 4,186, Momentum (10) recorded a weak reading today at 4,579, and the Moving Average Convergence Divergence (MACD) level stood at 1,855, reflecting constructive trend momentum. The overall oscillator signal remains largely neutral, with one positive signal, two negative signals, and eight neutral readings across the map.
Moving averages (MAs) continue to provide the strongest technical support for Bitcoin’s broader trend. The Exponential Moving Average (EMA) of 10 at $79,833 and the Simple Moving Average (SMA) of 10 at $79,947 both continue to support the upside. Additional readings across EMA 20, SMA 20, EMA 30, SMA 30, EMA 50, SMA 50, EMA 100, and SMA 100 all maintain positive signals as well, highlighting broad trend agreement over shorter and intermediate timeframes.
However, the EMA 200 at $82,020 and SMA 200 at $82,719 still reflect weak long-term positioning, suggesting that Bitcoin has not fully regained the strength of its long-term trend. Still, the technical backdrop remains heavily in favor of the bulls, as 12 moving average signals are positive against just two weak readings. Bitcoin may love drama, but the moving averages don’t seem too interested in bearish developments right now.
Bullish verdict:
Bitcoin continues to hold the important $79,500 to $80,000 support with sustained highs and lows across the daily chart. With 12 moving average signals, constructive moving average convergence divergence (MACD) momentum, and steady bullish buying activity near $80,400, the broader technical structure remains favorable for upside continuation. $BTC It clears the resistance near $81,100 and eventually retests $82,800.
Bear verdict:
Bitcoin remains trapped below a key resistance level near $82,800, but weakening momentum indicators such as the Commodity Channel Index (CCI) and Momentum (10) suggest that upside energy is not invincible. if $BTC Losing the $79,500 support zone on convincing volume could quickly push the current consolidation structure towards downside pressure, exposing a floor target near $78,000 or even $76,800.