Bitcoin is starting to show early signs of weakness after a recent rally towards the $80,000 resistance area. The market is currently facing a technically significant supply zone where sellers are becoming increasingly active and a broader correction is likely in the near term.
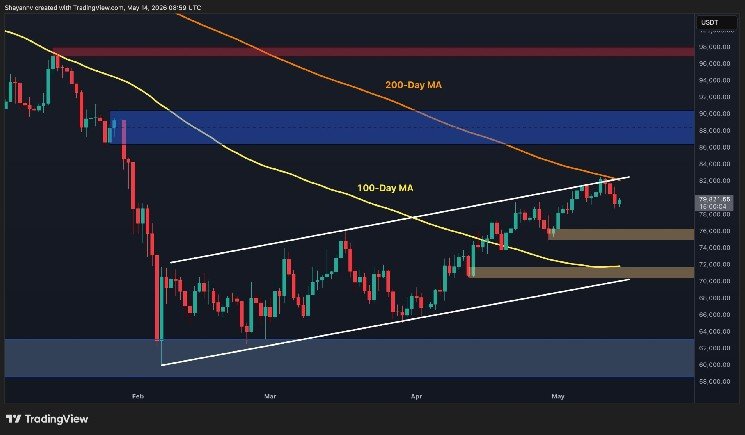
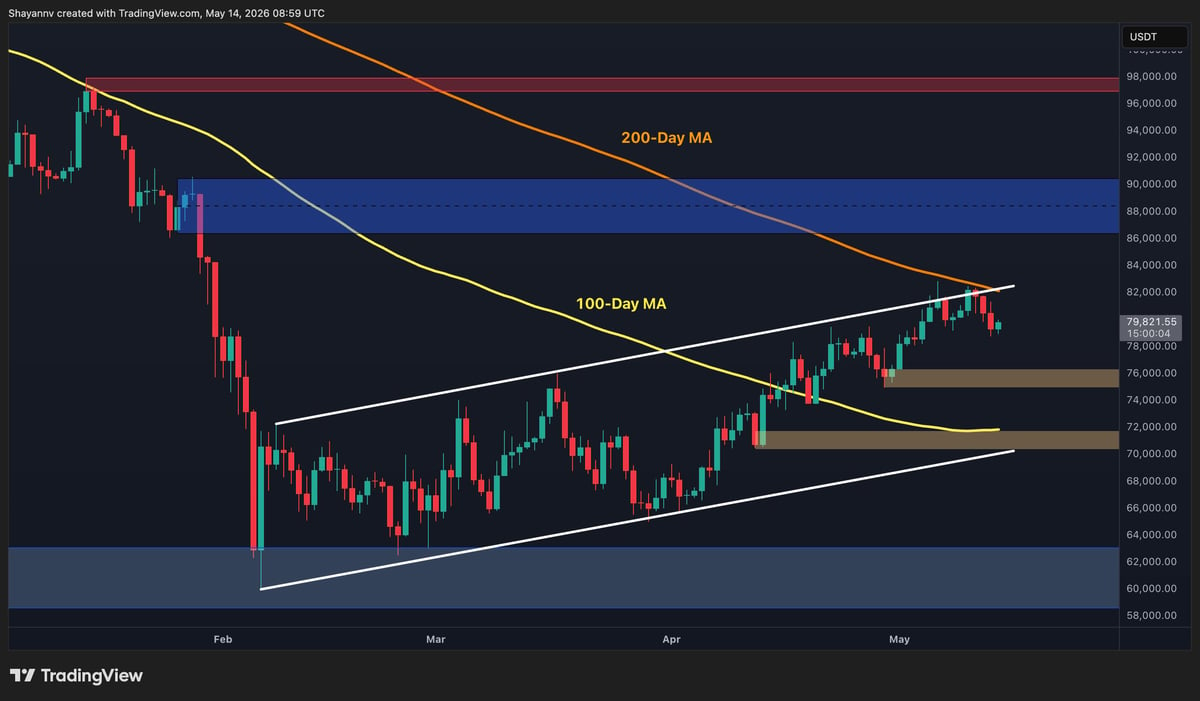
Bitcoin Price Analysis: Daily Chart
On the daily chart, $BTC The price has shown some bearish signs recently as it struggles to maintain bullish momentum around the key $80,000 resistance level. This area coincides with a strong confluence of supply, including the top of a broader ascending channel and the 200-day moving average near the $82,000 mark. The repeated failure to recover the area highlights the presence of active sellers in the market and increasing distribution pressure.
As a result, the probability of an extended bearish retracement has increased significantly. If sellers maintain control, Bitcoin could gradually fall toward a lower support zone, with the $75,000 region serving as the first major demand area. A deeper correction could expose a broader support zone around $70,000 to $71,000, which previously served as an important accumulation area for buyers.
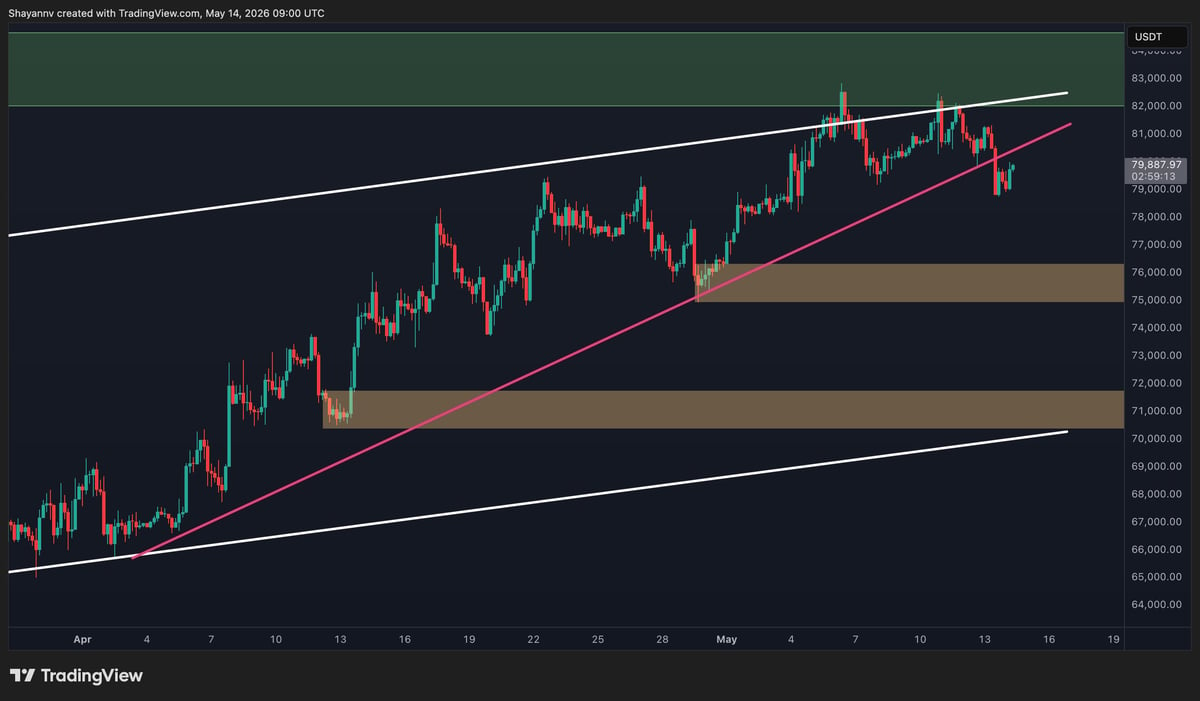
$BTC/$USDT 4 hour chart
On the 4-hour time frame, the market recently broke below the major uptrend line that has supported the latest bullish structure since the rebound from the $60,000 area. This bearish breakdown serves as an early warning sign that momentum is weakening and sellers are gradually gaining an upper hand in the market.
In addition, many participants gathered, $BTC During the recent capitulation towards the $60,000 support zone, it now appears to be locking in profits and reducing exposure near the resistance. This move increases selling pressure around the $80,000 level and further supports the possibility of further correction in the coming days. If the bearish momentum accelerates, the price could continue to decline towards the $76,000 hot demand zone and eventually reach the $71,000 area.
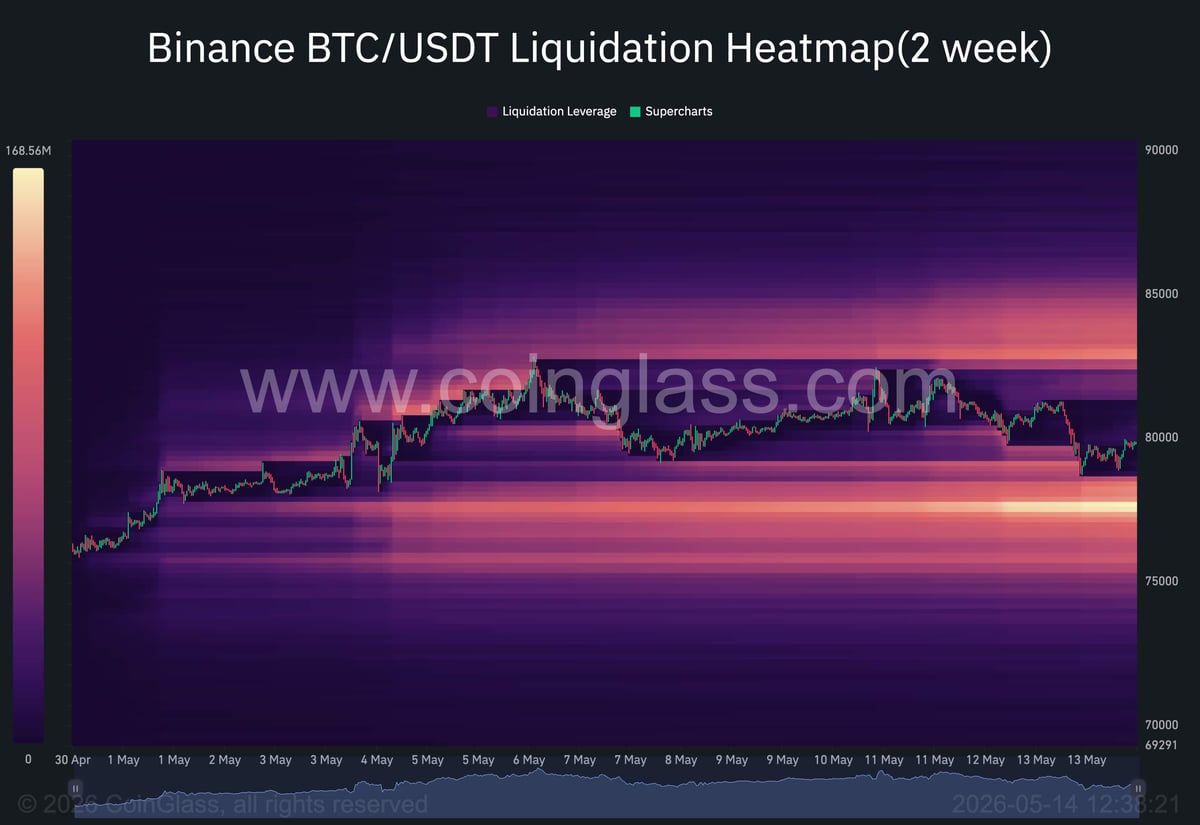
On-chain analysis
From a liquidation perspective, Binance $BTC/$USDT The heatmap reveals that significant liquidity is concentrated around the current market price, particularly around $77,000. Historically, markets tend to gravitate toward these high-liquidity zones to facilitate greater directional movement through forced liquidations.
The growth of this liquidity cluster below the market is further consistent with the current bearish technical structure observed on both high and low time frames. As long as Bitcoin stays below the critical resistance confluence around $80,000 to $82,000, a liquidity-driven decline towards the lower cluster remains likely.