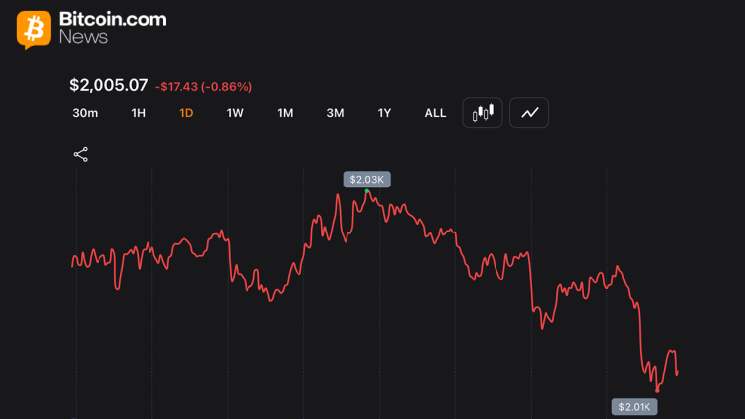
Ethereum is testing the $2,000 psychological support level after falling about 32% year-to-date in 2026, posting its worst first-half performance in years on the back of macro headwinds, sustained exchange-traded fund (ETF) outflows, and declining stock prices. $ETH/ $BTC ratio.
Important points:
- Ethereum is down about 32.4% year-to-date (year-to-date) through May 2026, with Coinglass data showing significant losses in January, February, and May.
- spot $ETH Approximately 9,000 ETF investors gathered $ETH On May 29th alone, there was continued selling pressure around the $2,000 support zone.
- The Gramsterdam upgrade, targeted for Q1 to Q3 2026, is expected to increase Ethereum’s gas limit by up to 3.3x and improve network efficiency.
$ETH track the pack
As of the end of May 2026, Ether has fallen from its all-time high of approximately $4,953, set in August 2025, and is trading between $2,000 and $2,020. In other words, the drawdown from the peak will be approximately 55% to 60%.
Coinglass’ monthly return data speaks for itself.
- January 2026: -17.52%
- February 2026: -19.81%
- March 2026: +6.97%
- April 2026: +7.3%
- May 2026: -11.01%
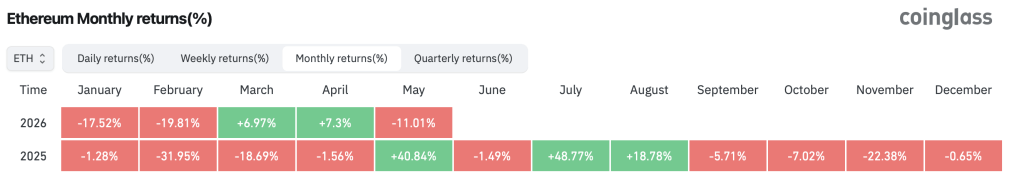
The cumulative loss year-to-date is approximately -32.4%, which is higher than Bitcoin’s decline of approximately -15% to -16.5% over the same period. of $ETH/ $BTC The ratio has fallen to a multi-year low of around 0.027, reflecting capital preference for Bitcoin amid uncertain macro conditions.
where $ETH Position among major altcoins
Ethereum’s performance places it in the bottom half of the major asset leaderboard in 2026. Tron (TRX) is up about 21%-23% year-to-date. BNB held up better, dropping about 14% to 16%. Dogecoin (DOGE) fell about 14%.
Solana ( SOL ) fell 33% to 39%, similar to Ether. In addition to this, both XRP and Cardano (ADA) have fallen around 27% to 29%.
ETF flows add pressure
Spot Ethereum ETF products have been experiencing consistent net outflows in recent weeks. On May 29 alone, net redemptions reached nearly 9,000. $ETH. Multiple days of consecutive outflows totaling hundreds of millions of dollars have directly weighed on prices, in contrast to previous periods of inflows.
On-chain picture remains stable
Despite the price drop, several network metrics remain strong.
- Approximately 33% of the total $ETH Supply is currently at stake and available selling pressure is limited.
- Ethereum’s decentralized finance (DeFi) ecosystem has a total of approximately $42 billion locked, making it the leading smart contract platform.
- The market capitalization of the Ethereum stablecoin market has reached approximately $161 billion.
- Foreign exchange reserves are decreasing and Whale Wallet data shows that they continue to accumulate around current price levels.
Gramsterdam upgrades on the horizon
The next major protocol upgrade, Gramsterdam, is scheduled for early-3rd quarter 2026. This hard fork follows Pectra and includes the introduction of proposer-builder separation (ePBS) to improve the fairness of transaction orders, an up to 3.3x increase in gas limits seen in testing, and a wide range of execution layer improvements. The developer testnet is up and stable as of late May.
What the chart shows
Technical analysts are keeping a close eye on the $1,975 to $2,000 range. A confirmation below this zone could pave the way for a move below $1,750, with some traders citing $1,400 as a possible cycle floor target. A defense of the $2,000 level, combined with broader market stabilization, could push Ether back towards $2,200-$2,500 as a relief measure.
Ethereum has historically shown sharp recoveries after significant drawdowns. The question for traders now is whether the macro environment will ease quickly enough for that pattern to repeat.