
Bitcoin just tested an intraday low of $61,349, causing around $1.76 billion in liquidations, with long positions absorbing more than $1.5 billion of that, before rebounding towards the mid-$63,000s.
Funding rates turned sharply negative, open interest reset sharply, and the Crypto Fear & Greed Index fell to 12, a level in extreme fear territory.
This has compressed a significant amount of technical work into a short period of time, and buyers who need to absorb remaining supplies have not yet confirmed their returns.
| market stage | what it means | Current BTC Evidence |
|---|---|---|
| liquidation bottom | Forced sellers are eliminated | $1.76 billion liquidation. Over $1.5 billion from long. Funding is significantly negative. Open interest reset |
| demand bottom | New buyers absorb remaining supply | Not confirmed yet. ETF outflows continue. Foreign exchange inflows increased. Spot seller is still active |
What is crash reset?
Lacie Zhang, a research analyst at Bitget Wallet, claims that the technical work done by the flash was genuine. He said in a note that a $1.76 billion wave of liquidations concentrated on long positions removed the most crowded bullish leverage from the order book.
The heavily negative funding rate indicates a shift in leverage bias from overheated longs to defensive, and the sharp reset in open interest means speculative positions are much cleaner than they were last week.
Zhang also discussed stock comparisons, noting that over the same period, the Dow fell 1.2%, the S&P 500 fell 0.7%, and the Nasdaq fell 0.9%, but there were no comparable deleveraging events.
Bitcoin’s 24/7 structure, higher leverage, and more reactive participant base mean it tends to price in macro stress faster than the stock market, compressing into a few sessions what stocks might absorb over weeks.
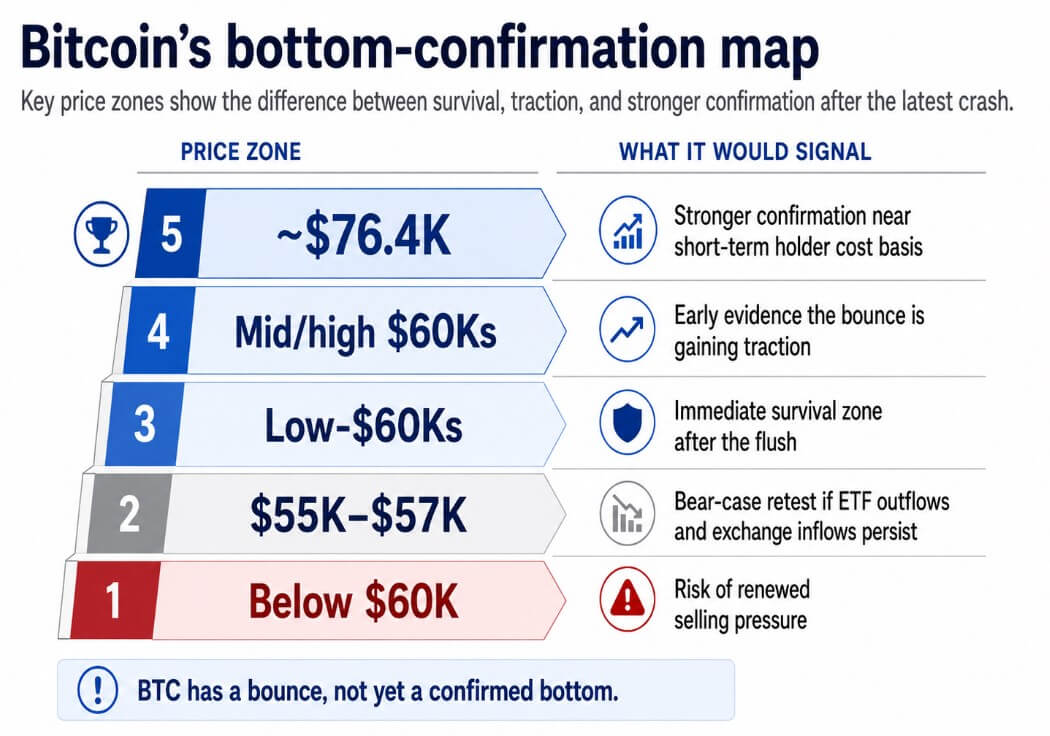
In that view, cryptocurrencies may already be closer to clearing this macro episode than traditional markets, and a retest of $55,000 to $57,000 remains realistic if ETF outflows continue, but the probability window for that range is narrowing as technical conditions reset.
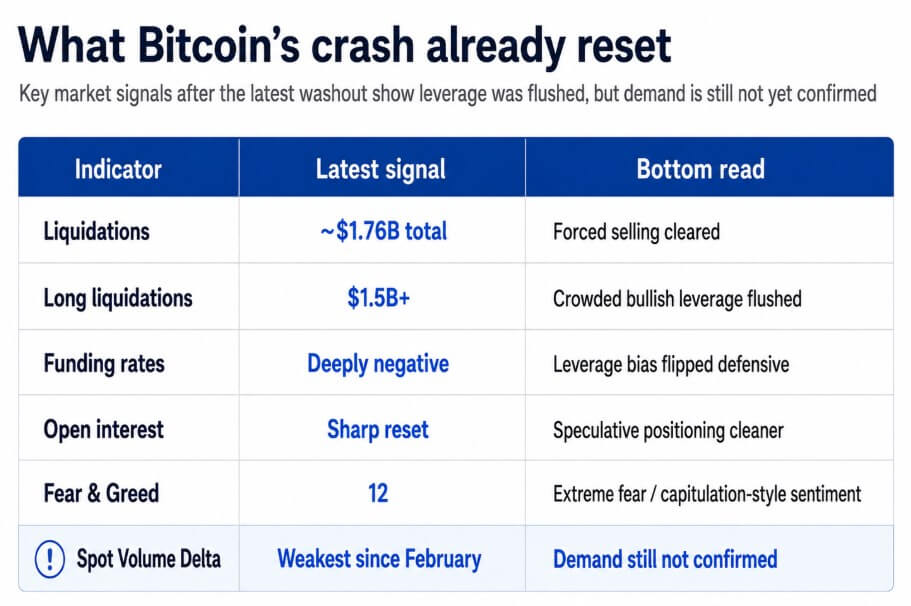
According to a June 3 report from Glassnode, Bitcoin fell 13% in seven days, the short-term holder cost basis fell to around $76,400, and the seven-day spot volume delta turned decisively negative, hitting its lowest level since February.
With spot selling dominating the order book despite the price rebound, Glassnode concluded that the market still lacks evidence of a sustained demand response.
Standard Chartered’s Jeffrey Kendrick maintained his end-2026 Bitcoin target at $100,000, saying that much of the sell-off may already be over, but cautioned that any move below $60,000 risks triggering a new wave of selling, and that there is no natural bottom in sight below that level.
Why Bounce remains a subject of suspicion
Nansen research analyst Nikolai Sondergaard reads the currency flow data as a direct challenge to the recovery narrative.
Both BTC and ETH recorded net inflows in the 24 hours after rebounding from $61,000, marking the first reversal since the June 1 lows. Traders who are moving coins onto exchanges are taking positions to sell or reduce their exposure, and the timing after the rally indicates participants will use the recovery as exit liquidity.
The ETF data has raised Sondergaard’s alarm as the U.S.-traded Bitcoin Spot ETF’s outflow streak extends to 13 in a row, accumulating about $4.4 billion in withdrawals.
Sondergaard said the outflows largely confirm the deterioration in sentiment, and that pension allocators and RIAs operating under compliance obligations are drawing a harder line by saying they won’t immediately restructure their exposures after reducing them.
The institutional bidding that helped keep Bitcoin between $50,000 and $126,000 in 2024-2025, in the form of a structural demand layer from allocators who could only access BTC through the ETF wrapper, has been withdrawn since May, and its return will be paced by the compliance review cycle.
Sondergaard also points out that leveraged long positions have not fully normalized, meaning further market consolidation may still continue even after a wave of liquidations.
Bottom confirmation checklist
The low $60,000 represents the immediate survival zone where the market absorbs the latest flashes, and the $60,000 handle itself serves as the psychological threshold that Kendrick identified as the line between suppression and acceleration.
If FX inflows and ETF outflows continue throughout this week, a retest of $55,000 to $57,000 represents a bearish case.
A rally to the mid-to-high $60,000s would indicate early traction for a rebound, but the short-term holder cost base around $76,400 is a stronger confirmation zone, a level that would bring buyers who entered during the previous rally back to breakeven.
ETF outflows should slow or reverse, indicating that the institutional investor base has stopped withdrawing liquidity, while BTC and ETH exchange inflows should decline to reduce short-term selling overhangs.
Whale accumulation needs to be strengthened to show that a large presence is actively absorbing supply. A clean reset that gets crowded again within a few days creates the same vulnerability as when the market was just unwound, so funding rates should normalize without immediately re-leveraging open interest.
Spot buys then need to actively fill the order book as liquidated longs disappear and new bids take their place, facilitating the recovery.
By the time these conditions appear in the data, Bitcoin has completed the forced sale phase of this correction, but spontaneous sellers such as ETF redemptions, exchange depositors, and compliance-driven risk averses are still active, and the rebound from $61,500 remains a positioning event until buyers confirm it as a floor.
(Tag translation) Bitcoin