
Bitcoin price today has fallen to $62,828 amid extreme fear, with market sentiment looking grim and presenting a highly uncertain outlook. The Fear and Greed Index fell to 12, a level that sometimes signals a market bottom but also suggests a capitulation event that often traps sellers.
The Daily Picture: Structurally Collapsed Market
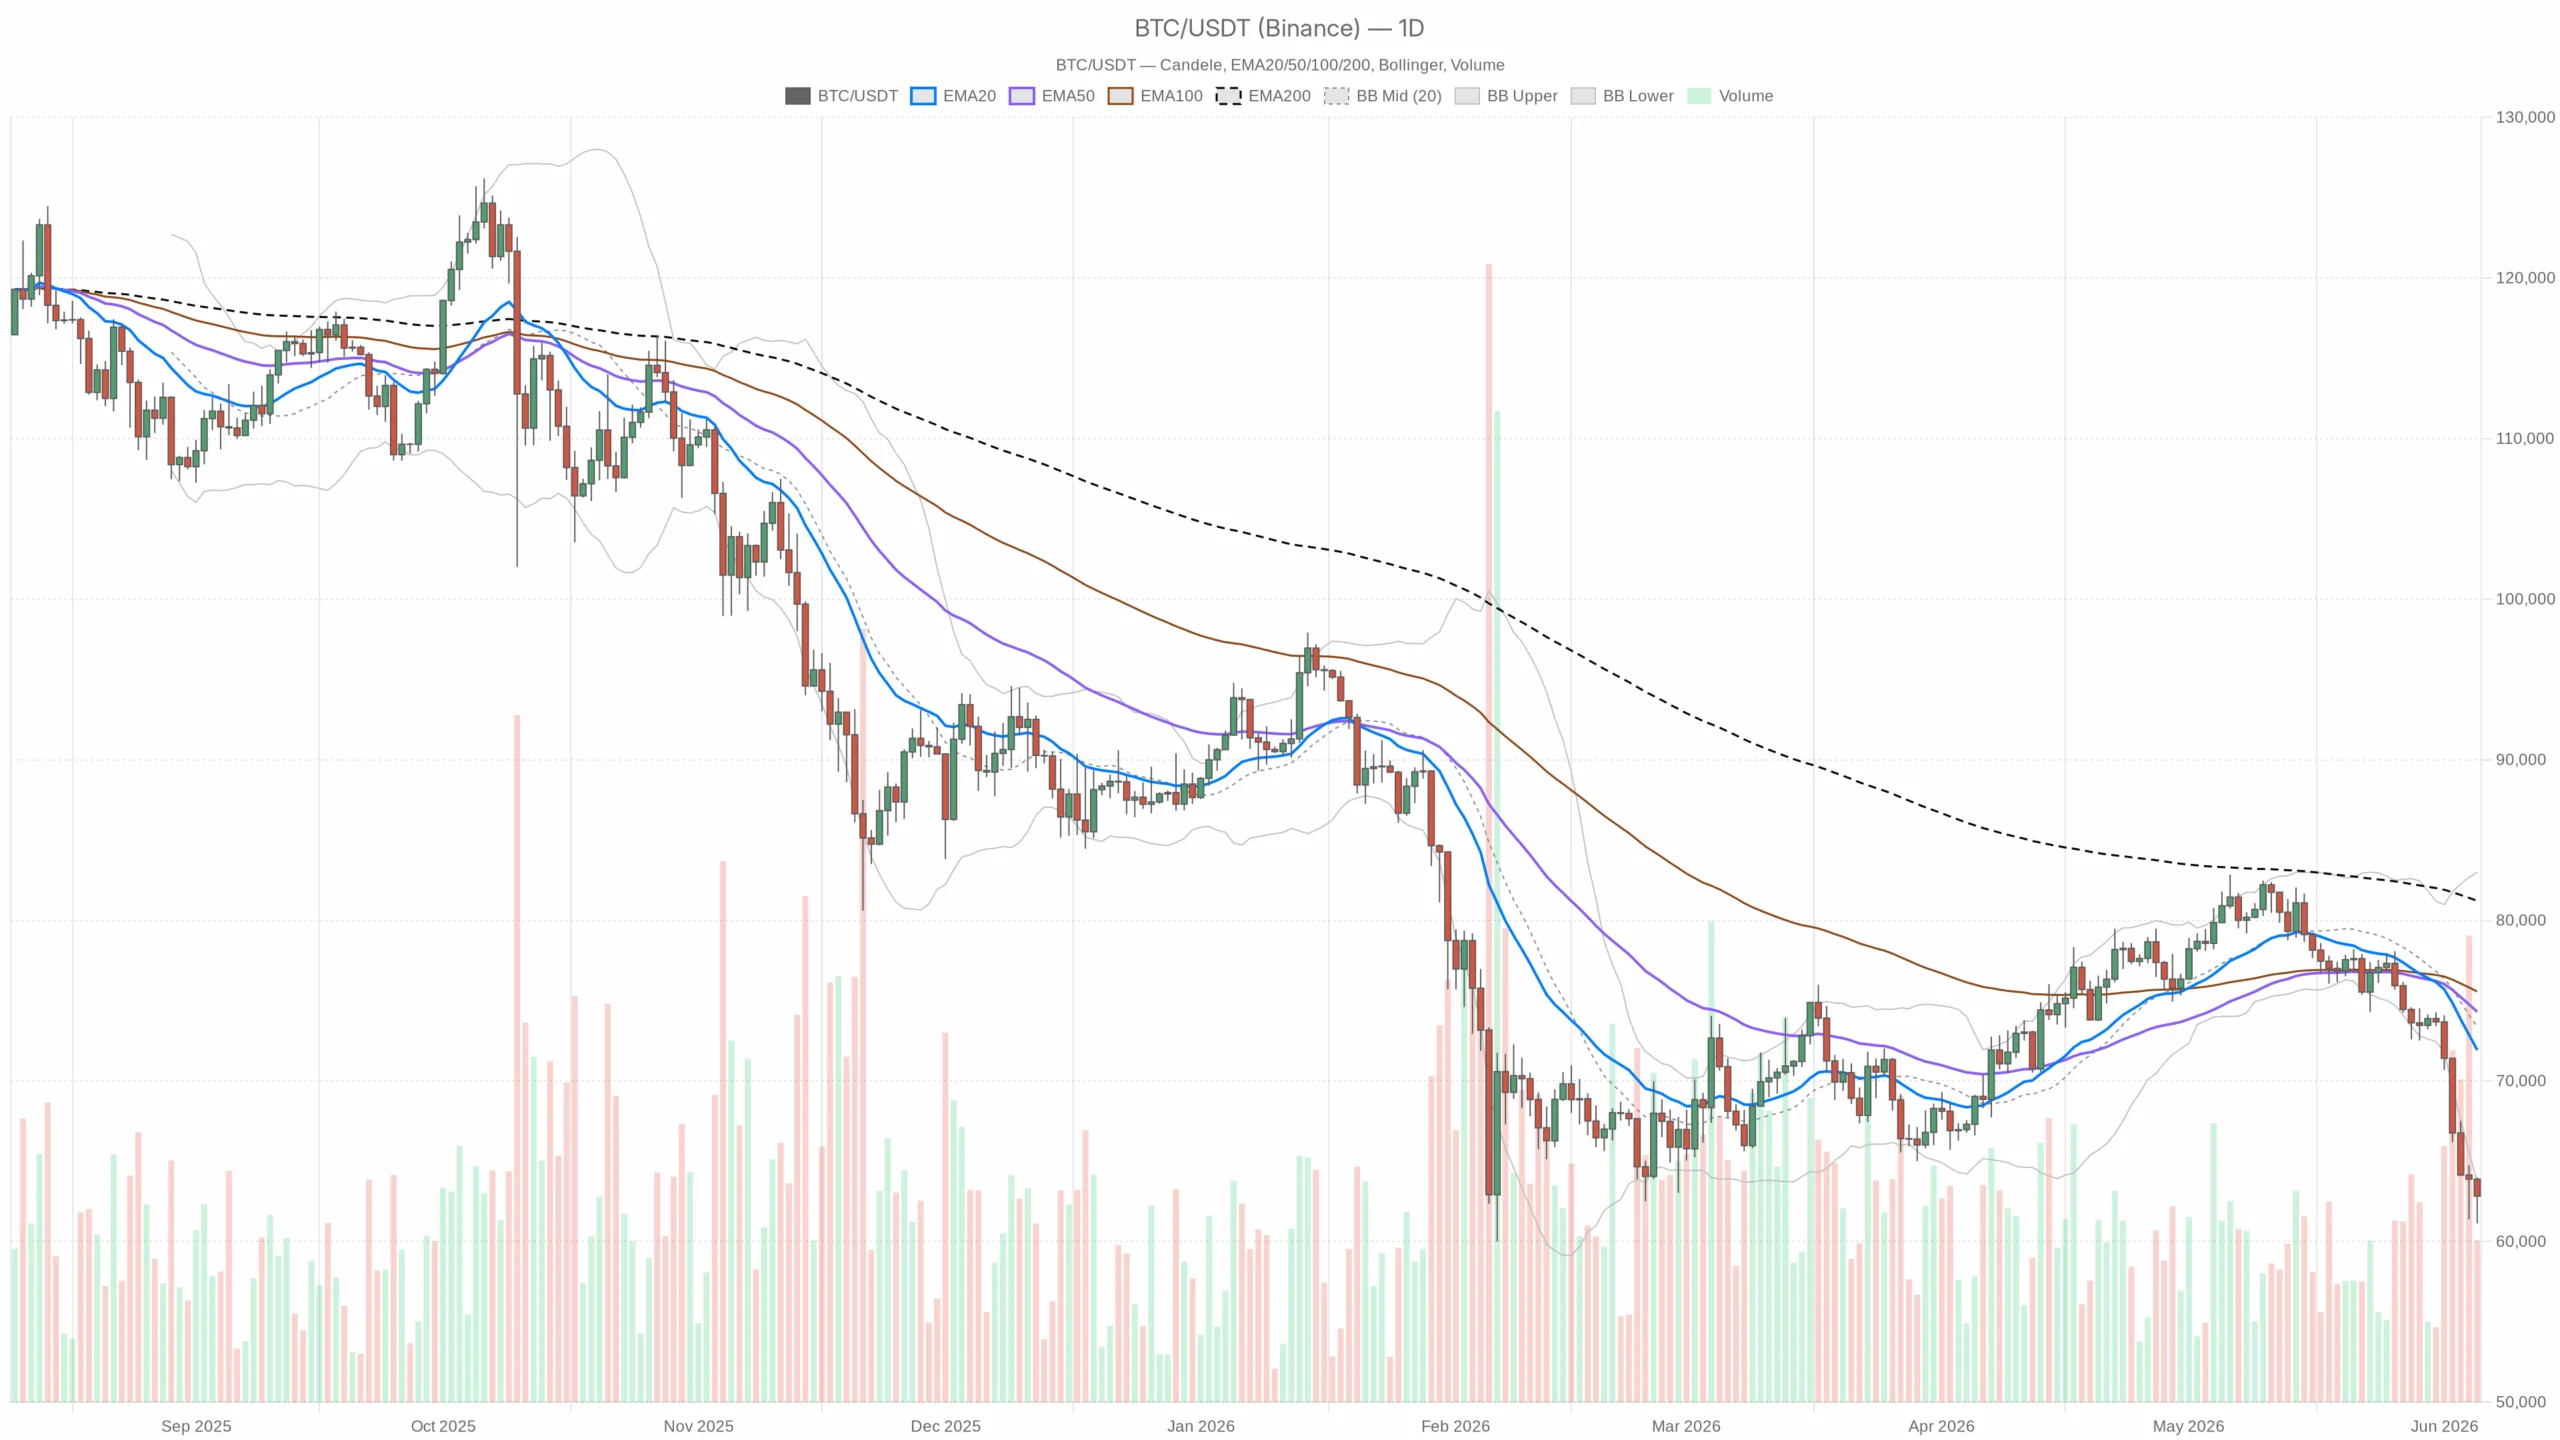
The daily chart confirms the bearish regime. Bitcoin is trading well below all major moving averages. The 20-day EMA is $71,924, the 50-day EMA is $74,303, and the 200-day EMA is $81,215. This large gap highlights a complete structural collapse rather than a routine decline, indicating a lack of trend coherence.
The daily RSI of 17.27 is the most oversold level in years, reflecting intense selling pressure and exhaustion. This does not yet guarantee a bottom, but it does suggest that there is room for the average to bounce back when the situation normalizes.
The MACD reading remains significantly negative and momentum is accelerating downward. The daily histogram is expanding negatively, with no bullish crossover emerging and seller control continuing to tighten.
The price is trading below the Bollinger Band floor at $63,718, a rare bearish condition where the Bollinger Band is acting as resistance. The increase in volatility is confirmed by the average true range of $2,425, suggesting significant intraday swings and increased risk.
The immediate price pivot places support at $61,310 and resistance near $63,162. Bitcoin is currently hovering around a pivot point, creating a precarious balance as a drop below support would likely signal a further sharp decline.
Hourly chart: signs of stabilization, but nothing more
On the hourly time frame, Bitcoin price today ended at $62,825, below the 20 EMA of $63,250 and 50 EMA of $64,477, keeping the bearish classification intact. A slight positive crossover in the MACD histogram suggests that selling momentum is weakening, but with an RSI of 44.68, the market is still in short-term relief mode with no buyer control. Prices are hovering near the lower end of the Bollinger Bands, indicating more cautious stabilization rather than a strong rebound.
15 minutes: The only bright spot — and a very small spot.
The 15-minute chart shows a neutral situation with an RSI of 51.2 and a positive MACD histogram. Bitcoin is just above the 15-minute EMA20 at $62,853, indicating preliminary short covering. However, this is just intraday noise within the broader daily breakdown until confirmed by a steady movement through a short-term pivot.
Market conditions: This is not just a Bitcoin issue
Bitcoin’s dominance remains relatively strong at 56.22%, suggesting that altcoins are suffering more during this downturn. The market capitalization of cryptocurrencies fell by 2.07% in 24 hours to $2.24 trillion, and trading volume fell by nearly 69%, indicating less liquidity than a healthy sell-off.
Institutional investor activity has recently turned negative due to Strategy’s stock sales, increased ETF outflows, and competition for capital through IPOs. The widest underperformance of Bitcoin’s stock price since 2019 highlights the ongoing rotation of risk capital from severe crypto and macro headwinds.
On decentralized exchanges like Uniswap, rising fees suggest increased hedging and risk management rather than buying enthusiasm, confirming that traders are repositioning rather than accumulating.
bullish scenario
A meaningful rebound will depend on a mean reversal from these extreme oversold levels. Historically, when the daily RSI dips below 20, it often recovers by 10-20% over several weeks. A break above the support at $61,310 and a close above $63,250 could enable a move towards $65,000 to $67,000. If the daily closing price rises above the lower Bollinger Band of $63,718, it will confirm that the breakdown situation is moderate. This scenario will fail if the price falls decisively below $61,310.
bearish scenario
The easier path is down. Negative momentum is accelerating and macro pressures such as ETF outflows and weaker institutional demand remain below key EMAs, supporting further declines. A confirmed close below $61,310 would open a technical gap towards the $58,000-$59,000 zone. Once the lower Bollinger Band is broken, the key support level is lost and the downside risk becomes more pronounced. Only a strong daily reversal above $63,718 would invalidate this bearish view.
How do you think about positioning here?
Two plausible narratives with equal short-term conviction create a challenging environment for positioning. The 17-year-old RSI warns against going recklessly to extremes. Similarly, short-sided chases carry the risk of potentially violent bounces from overstretched conditions. A daily ATR of $2,425 highlights the need for strict risk management amid heightened volatility.
Traders should monitor the support at $61,310, the hourly close near $63,250, and especially the volume as it attempts a recovery. Thin volume bounces in this setting tend to be traps rather than true reversals.
This analysis is based on publicly available data as of June 5, 2026. It reflects the interpretation of the author, for informational purposes only.