
Ethereum ($ETH) fell below $1,800 on Thursday, the first time it has fallen to this level since February 2026.
The weak performance comes amid accelerating spot selling and increasing distributions from long-term holders.
This move adds to a broader bearish wave across crypto markets due to sustained risk-off sentiment.
Technical indicators suggest that the decline may continue for some time, with the $1,380 support level likely to be a target.
Acceleration of distributions by long-term holders
Ethereum has fallen 5% in the past 24 hours and is currently trading near the $1,770 level.
The bearish performance comes as on-chain data shows a clear increase in sales activity from previously inactive wallets.
The consumption age indicator, which tracks the movement of dormant or long-held tokens, has spiked over the past two days. $ETH I declined. This suggests that long-term holders (LTH) are increasingly participating in sales.
Historically, spikes in this index have coincided with periods of heightened distributional pressure, often leading to stronger downward momentum.
Furthermore, the realized P&L indicator shows that the recent sell-off is from underwater positions.
Although daily losses remain modest, they have been consistently negative since April. This suggests that the selling pressure is being driven by risk aversion, with holders exiting positions at a loss, and that overall confidence among market participants remains weak these days.
This steady increase in realized losses indicates continued distribution rather than short-term profit taking.
On the institutional side, demand for Ethereum products has decreased in recent weeks.
The U.S. Spot Ethereum ETF has recorded 16 consecutive days of net outflows, the longest since its inception in July 2024.
The trend highlights a decline in institutional inflows at a time when the spot market is already under pressure.
Despite falling prices, the position of derivatives remains mixed.
Open interest remains above $26 billion and funding rates remain positive. Moreover, the market is dominated by long positions.
This suggests that traders are still betting on a short-term rebound even though spot prices continue to fall.
Ethereum technical outlook: bearish trend remains
of $ETHThe 4-hour chart of /USD is extremely bearish as Ethereum has lost 11% of its value over the past 7 days.
At the time of writing, Ethereum is trading below the 20-day EMA, 50-day EMA, and 100-day EMA (all centered between approximately $2,030 and $2,245), reinforcing the bearish trend despite being significantly oversold.
A Relative Strength Index (RSI) of 27 means Ethereum is currently in oversold territory.
The MACD line is also in negative territory, adding further confluence to the bearish narrative.
If the bulls regain control, they will target the first major support-turned-resistance level at $1,909, with the next level at $2,018.
If the daily close is above these levels, bulls could extend the upside and target the 20-day, 50-day, and 100-day EMAs (all centered around $2,030 to $2,245).
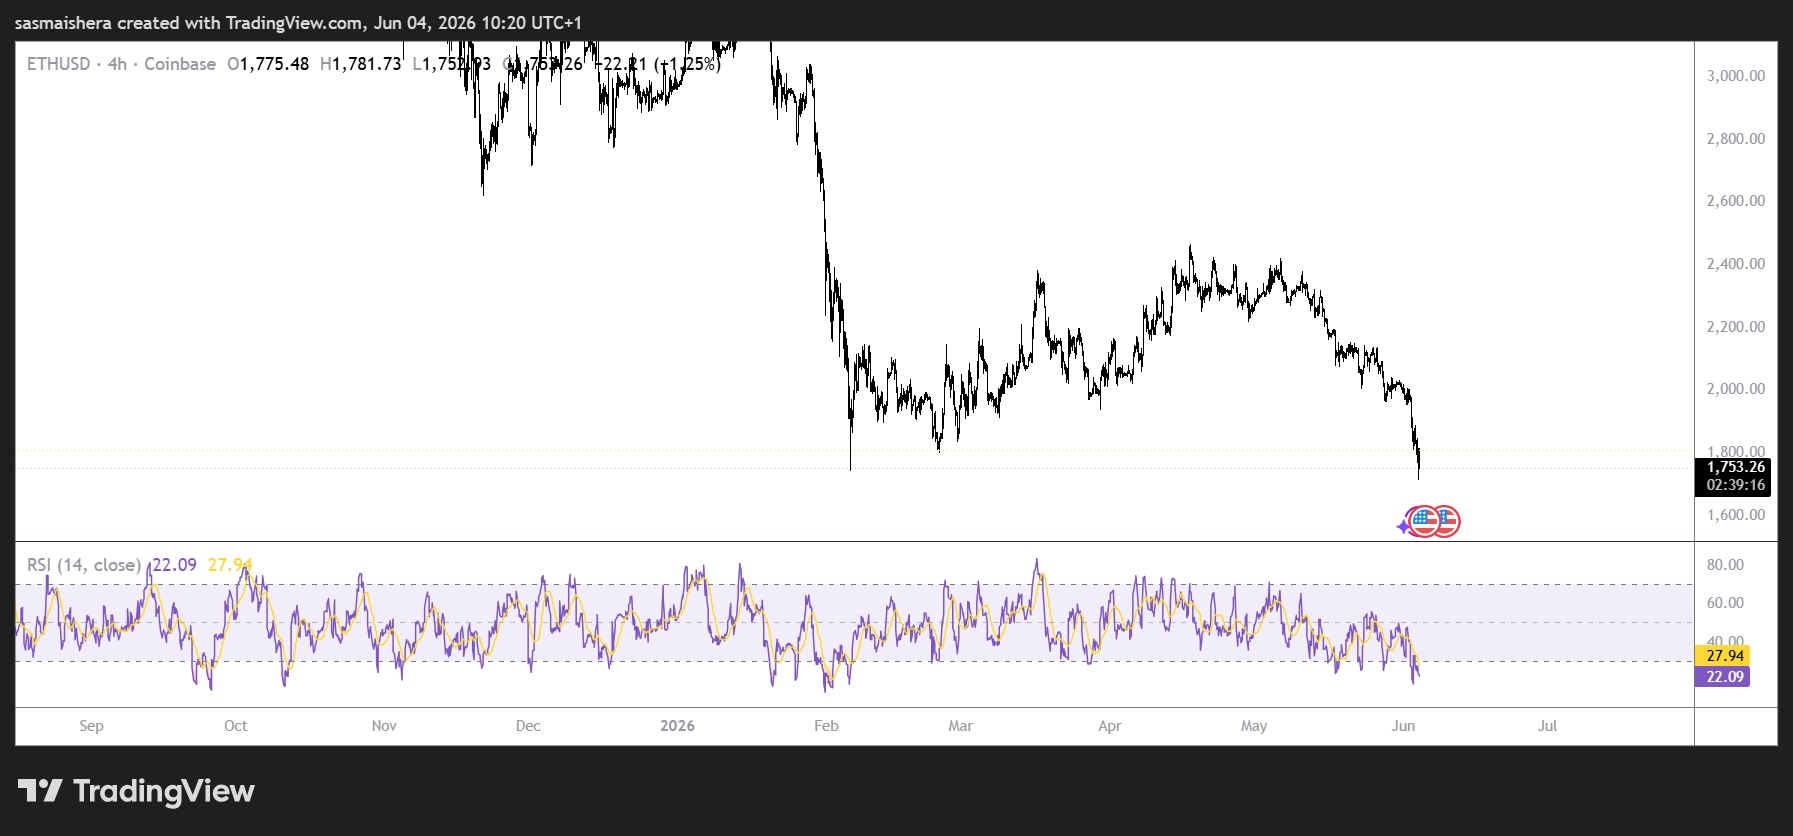
However, if the decline continues, $ETH A break below the support at $1,740 could extend the decline towards the next major level at $1,524.
The weekly chart suggests a floor near the $1,380 level, which was last tested on March 31, 2025.