
Standard Chartered maintained its call for Bitcoin to reach $100,000 by December 31, even after the currency briefly fell below $60,000 last week for the first time since October 2024.
Jeffrey Kendrick, the bank’s global head of digital asset research, called the decline “painful,” but argued that much of the sell-off may be over, adding that investors may later view the zone as the buying opportunity they’ve been hoping for.
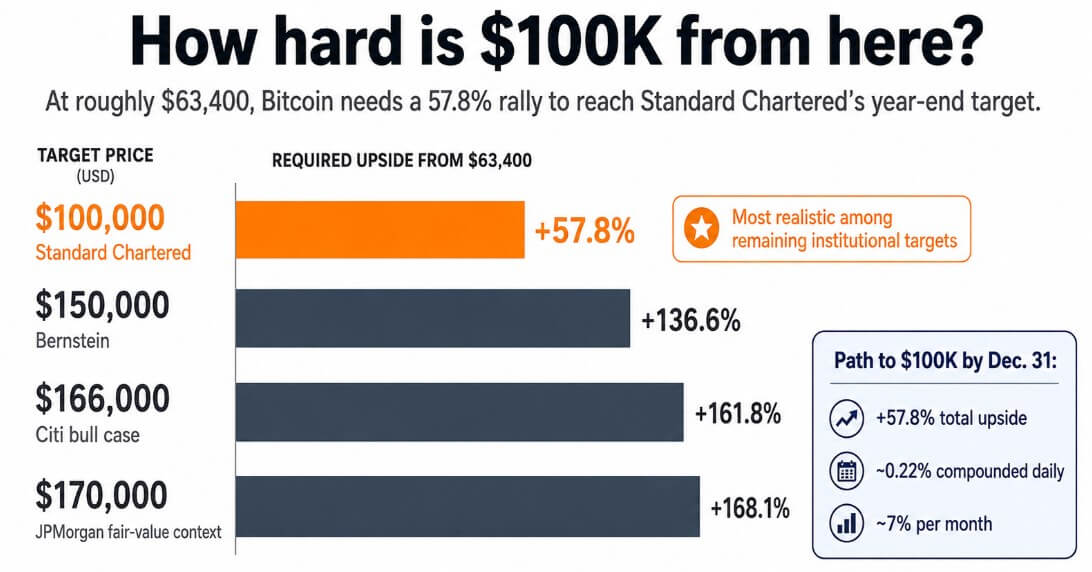
Bitcoin’s price is around $63,400, and to reach $100,000 by December 31st, it would need an increase of about 57.8% in about 206 days, or about 0.22% compounded daily, or 7% per month.
Bitcoin has matched that pace before, but the market is reassessing the likelihood of it happening again.
what is causing the damage
Bitcoin’s slide towards $60,000 was driven by record ETF outflows, Strategy’s first Bitcoin sale since 2022, and forced liquidations totaling $1.8 billion in a single transaction.
The policy pushed the Crypto Fear and Greed Index up to 12, sending Bitcoin more than 51% below its October 2025 all-time high as U.S.-traded spot ETFs shed about $4.4 billion in 13 consecutive outflow sessions and institutional money moved into AI stocks.
The sale of 32 BTC by Strategy hit the market as a psychological shock, causing a drop that the size of the sale was not justified. Mr. Kendrick acknowledged that the timing was bad, but cited the company’s history of buying back more than it cost in each sale.
Strategy revealed new purchases from June 1 to June 7, which Kendrick cited as evidence that the aggressive buying pattern he predicted had already begun.
The bank lowered its year-end target twice before the reconfirmation, from $300,000 in December to $150,000 in January and $100,000 in February, making the June 4 level the first since the sell-off accelerated.
4 conditions
The path to $100,000 requires adjusting four things, starting with ETF outflows no longer setting a marginal price. After a record 13 consecutive sessions of outflows, flows turned slightly positive by early June, giving bulls a tangible reversal trigger to watch for.
The strategy needs to remain a buyer, as June’s purchases confirm, and regulatory developments around the CLARITY Act need to re-enter the institutional calculus.
Fourth, Bitcoin needs to regain major trend levels. The 30-day moving average near $75,685 and the 200-day moving average near $78,840 represent technical thresholds that separate a crash recovery from a new uptrend.
| situation | current signal | bullish confirmation |
|---|---|---|
| ETF flows will stabilize | Spot Bitcoin ETF just emerged from 13 consecutive sessions of outflows totaling approximately $4.4 billion | Net inflow over several weeks |
| Strategy remains buyer | Strategy sold 32 BTC and subsequently revealed new purchases from June 1st to June 7th | Continue the purchase without further symbolic sales |
| Regulatory momentum returns | Progress on the CLARITY Act remains unclear | Senate Floor Schedule or Clearer Market Structure Pathway |
| Bitcoin regains trend levels | BTC remains below the 30-day moving average near $75,685 and the 200-day moving average near $78,840. | Continuous rise above $75,000-79,000 |
Mr. Grayscale argues that the four-year cycle theory will prove to be false in this era of institutional capital, where steady inflows of capital are expected to replace the old boom-and-bust rhythm, and this view will support a faster recovery than historical patterns suggest.
Fidelity analysts are divided, with some favoring the supercycle theory and others, like macro director Julian Timmer, arguing that the traditional cycle pattern remains intact.
Bernstein as recently as March 24 set a year-end target of $150,000, calling the current drawdown “the weakest bear case in Bitcoin history,” and while it remains on the more aggressive end of the bullish spectrum, the company has not newly reaffirmed that claim since the crash.
Citi’s base case remains above $100,000 after the March target cut, and the bull case is up to around $166,000, but reaching either number from $63,400 would require upside of 76.7% and 162%, respectively, making Standard Chartered’s $100,000 the most defensible of the remaining institutional targets.
The bottom of the cycle is too slow
Cycle analysts tracking the 2024 halving rhythm will set a historical low on approximately day 900 of the halving.
The current cycle is at day 775, with about 125 days until that window opens, marking the October bottom, with previous cycles suggesting lows in the $40,000 range.
Under that timing, the hypothetical October floor of $50,000 would require compounding daily by about 0.76% until December 31st to reach $100,000, more than three times the daily pace that Standard Chartered’s current price target would suggest from today’s price.
Prediction market traders at Calsi say there is a 66% chance that Bitcoin will fall below $55,000 this year, and a 50% chance that the price will fall below $50,000.
Another Kalsi market puts a 52% chance that Bitcoin will fall below $50,000 this year, a level last seen in August 2024. These probabilities reflect that the circulation of capital into AI stocks, semiconductor ETFs, and high-profile IPOs could result in a permanent reallocation, with no clear catalyst to shift it back to Bitcoin in the short term.
A sustained break below the $60,000 floor over multiple sessions and a decline in the lows and highs will likely shift traders’ focus to the $50,000 area and the 200-week moving average of $61,778, which Bitcoin reached last week for the first time since 2023.
The global regulatory context further heightens the risk, as EU MiCA implementation begins on July 1st, after which unlicensed crypto service providers will have to cease servicing EU customers, removing a layer of regulatory arbitrariness that provided institutional cover to preserve assets through uncertainty.

Where is the probability stack?
JPMorgan’s fair value model, built on volatility-adjusted gold comparisons, points to $170,000, but this estimate predates the crash and serves as long-term context rather than short-term price judgment.
Galaxy Digital’s Alex Thorne reportedly lowered his prediction for Bitcoin bill passage in 2026 from 75% to 60%, citing risks in the Senate calendar.
The resulting probability stack is Standard Chartered at $100,000, Bernstein’s continuation target at $150,000, Citi’s lowered but still base case above $100,000, and Kalsi’s market pricing in only a 21% chance of Bitcoin exceeding $100,000 by January 2027.
| source/market | signal | interpretation |
|---|---|---|
| standard chartered | $100,000 by December 31st | New reconfirmation after collision |
| City basic case | over $100,000 | Declined but still bullish |
| bernstein | $150,000 | Still a target, no new reconfirmation after crash |
| JP Morgan Model | $170,000 | Old fair value background |
| Kalsi: BTC will exceed $100,000 by January 2027 | twenty one% | Market price is $100,000 possible, unlikely |
| Kalsi: BTC will drop below $55,000 this year | 66% | Traders are still pricing in downside risk |
| Kalsi: BTC will fall below $50,000 this year | 50%-52% | Drawdown risk remains central |
The discrepancy between analysts’ goals and market price outcomes is the most accurate summary of the current situation.
The $100,000 call moved from a bull market assumption to a stress test of whether ETF demand, strategy buying, regulatory momentum, and macro easing can overwhelm the damaged tape before the calendar runs out.
Standard Chartered’s Jeffrey Kendrick was the only major institutional investor to definitively reaffirm Bitcoin’s $100,000 mark after it fell below $60,000, and the next crucial test will be whether the asset can regain $75,000 by October, when the expected downside window for the four-year cycle opens.
(Tag translation) Bitcoin