Bitcoin ( $BTC) is trading at $64,549 per coin as of 8:00 AM ET on June 14, 2026, above a key demand zone, while the daily chart shows a bearish technical assessment and the lower time frame shows the first signs of stabilization since the multi-week decline from highs near $82,969 in early May.
Important points:
- Bitcoin is trading at $64,549 as of June 14, 2026, with 11 of the 14 moving averages (MAs) showing bearish signals.
- $BTCThe 1-hour and 4-hour charts of have made new lows, and the MACD and momentum indicators have both turned positive.
- a $BTC If the price closes below $59,000, the current relief structure will be invalidated and there will be a risk towards the $50,000 zone.
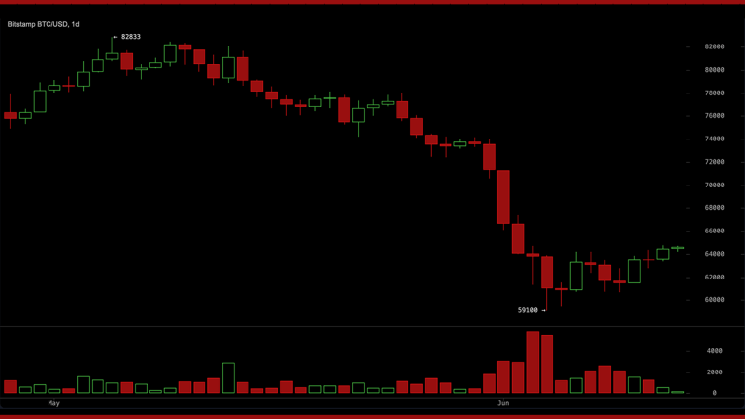
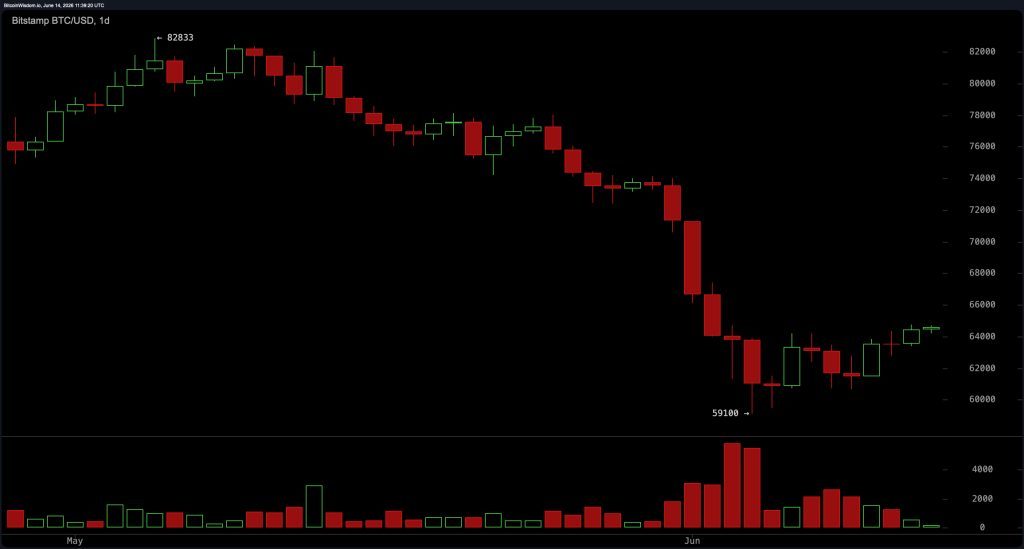
Daily chart: Corrective structure continues below long-term average
On the daily chart, Bitcoin is in a correction phase that began after the price peaked around $82,969 in early 2026, falling to a range of $59,215 from recent lows of $59,100. The price has since rebounded to the $64,500 area and remains close to the 200-week simple moving average (SMA), a level that has historically served as an important support floor.
The daily technical rating is bearish overall, primarily driven by price trading below most of its long-term moving averages. Selling pressure has eased compared to the initial drawdown, but volume remains moderate and no trend reversal has been confirmed at the daily level. The $65,000 to $67,000 zone represents the first meaningful resistance band that traders are watching for potential directional signals.
4-hour chart: rising lows indicate short-term stability
The 4-hour chart shows a more constructive setup, with Bitcoin forming higher lows following a sharp decline that pushed the price into the $59,000 area. This high-low structure, combined with easing oversold conditions, suggests that aggressive downside momentum may be exhausted in this time frame.
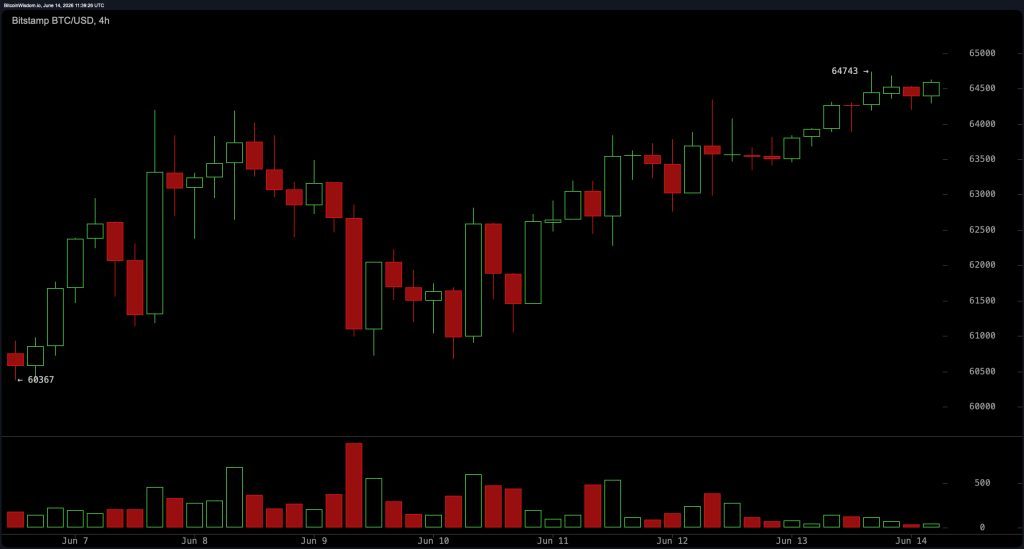
Price has recovered to the $62,000-$64,000 zone, and the bias on the 4-hour chart is neutral to slightly positive for short-term relief. Major support lies between $61,500 and $62,700, and resistance lies between $64,000 and $65,000. A pullback to the $62,000 to $62,700 range on volume confirmation represents the clearest entry zone for traders positioning for a short-term rebound, with initial targets in the $64,500 to $65,500 area.
Hourly chart: Intraday structure favors tactical longs
The 1-hour chart has the most positive structure of the three time frames analyzed. $BTC It shows an attempt at higher lows and some bullish momentum after the previous oversold reading cleared. Intraday support holds around $62,700, while resistance lies in the $64,500 to $65,000 zone, which is consistent with current price action.
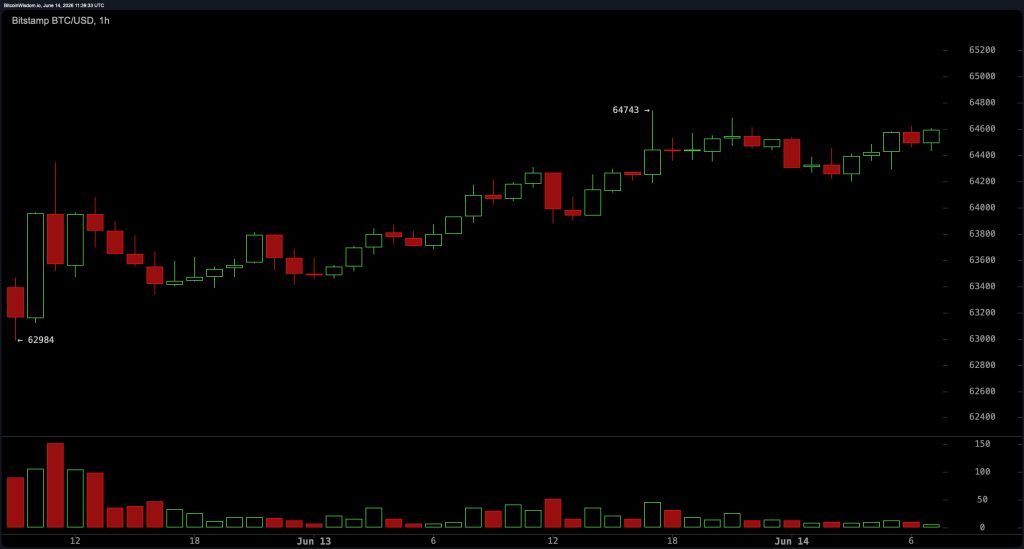
Indicators on lower time frames, including a positive signal on the Moving Average Convergence Divergence (MACD), are consistent with the possibility of a continued intraday rebound. Traders focused on tactical short-term entries are using the push from $62,700 to $63,000 as a reactive long zone, with a scalp target of $64,800 to $65,500 and a tight stop below $62,500 to limit downside exposure on a setback.
Oscillator: Neutral consensus with isolated positive signal
Currently, seven oscillators are neutral on Bitcoin’s daily chart, while two are giving positive signals and no oscillators are recording negative readings. The Relative Strength Index (RSI) for period 14 is 37, a neutral signal that the price is close to but not in oversold territory. The stochastic number is 34, which is also neutral. The Commodity Channel Index (CCI) for period 20 is negative 35, neutral.
The average directional index (ADX) for period 14 shows 45, indicating neutral trend strength. The Awesome oscillator outputs negative 8,290, neutral. Momentum for period 10 reads 682, giving a positive signal. The Moving Average Convergence Divergence (MACD) for levels 12 and 26 is negative 3,291 and also recorded positive. The summary of the combined oscillators is entirely neutral. There are 0 negative signals, 9 neutral readings, and 2 positive values.
Moving averages: bearish pressure prevails for a long time
Moving average (MA) data paints a bearish structural picture over a longer time frame, with 11 of the 14 trailing averages recording negative signals. The 10-period exponential moving average (EMA) is holding at 64,200, which is a bullish signal, as is the 10-period simple moving average (SMA) at 62,742. From the 20-period sideways, all tracked moving averages show bearish signals. The 20 period EMA is 66,624, the 20 period SMA is 66,882, the 30 period EMA is 68,633, and the 30 period SMA is 70,274.
As the average gets longer, the difference gets wider. 50 period EMA is 70,810, 50 period SMA is 73,901, 100 period EMA is 73,412, 100 period SMA is 72,626, 200 period EMA is 78,792, 200 period SMA is 77,643. Bitcoin trading below each of these levels confirms a bearish moving average structure on the daily time frame. A definitive close above $65,000 to $67,000 will begin to close the gap with the nearest negative signal average.
Bullish verdict:
Bitcoin’s 1-hour and 4-hour charts remain low, the Moving Average Convergence Divergence (MACD) and momentum indicators are both positive, and the price is positioned at the 200-week simple moving average (SMA), a level that has historically absorbed significant selling pressure. If buyers stick to the $62,000-$63,000 support zone and volume recovers, a push towards $65,000-$67,000 is the next logical target. The oscillator panel contains a negative reading of zero, meaning there is no confirmation of the downside at this stage.
Bear verdict:
With 11 of the 14 moving averages negative, the price is still well below the 200-period exponential moving average (EMA) of $78,792, and no trend reversal has been confirmed on the daily chart. The pullback from $59,100 appears to be more correctional than impulsive, and the $64,500 to $65,000 resistance zone has not been cleared with any confidence. Failure to hold $62,000 would re-open the way to the $59,000-$61,000 demand area, and a daily close below $59,000 would bring the $50,000 zone back on the table.