
Volatility in option expirations, prolonged liquidations, and renewed concerns about companies selling Bitcoin weighed on sentiment across the crypto market, sending Bitcoin down to around $62,400.
According to data from crypto.news, Bitcoin ($BTC) has fallen nearly 3% in the past 24 hours, hitting an intraday low of around $62,300 on June 19th. The decline widened losses as around $2.13 billion worth of Bitcoin and Ethereum options contracts expired.
Investors also digested reports that Strategy could sell $3 billion to $4 billion worth of Bitcoin to support its STRC preferred stock, which has recently traded below its $100 par value.
Furthermore, according to CoinGlass data, approximately $136 million worth of Bitcoin positions were liquidated in the past 24 hours, of which approximately $122 million was due to long positions. A cluster of bullish liquidations increased selling pressure as leveraged traders exited positions during the decline below $63,000.
Outside of cryptocurrencies, investors faced another challenging macro backdrop. Markets continue to assess the impact of Federal Reserve Chairman Kevin Warsh’s first policy meeting, with policymakers increasingly betting that interest rates may remain high for an extended period of time. The subsequent strengthening of the US dollar increased pressure on risk assets, including cryptocurrencies.
Energy markets provided little relief. Oil prices rebounded from around $75 to more than $77 a barrel after planned U.S.-Iranian talks in Switzerland were called off and Israel continued its attacks on Hezbollah targets in Lebanon. Still, oil continued its downward trajectory for the week as traders continued to price in improved shipping conditions through the Strait of Hormuz following an interim peace deal between the US and Iran.
Another source of pressure emerged from the mining sector. Bitcoin spending has fallen below the estimated network production cost of about $78,000 for the fifth month in a row, according to institutional analysis. The prolonged gap has reportedly forced some mine operators to liquidate their holdings to cover operating costs and debts.
Bitcoin tests important Fibonacci and moving average support
What technical indicators indicate $BTC Trading at a major inflection point. On the 4-hour chart, the price was measured from a June low near $59,176 to a recent recovery high near $74,288 before falling to the 78.6% Fibonacci retracement level near $62,410. Below this level, the June bottom will be the next major support zone.
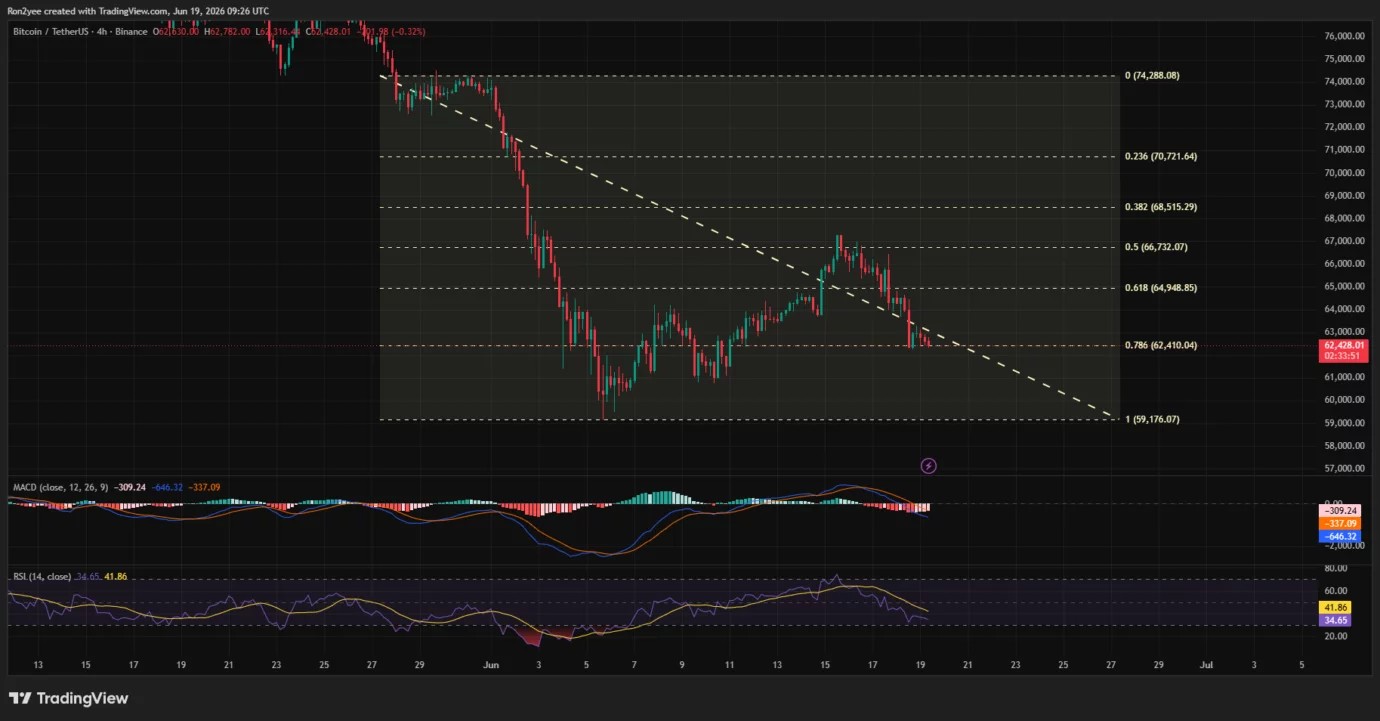
Momentum indicators remain weak. The 4-hour RSI has dropped to around 35, but the MACD is still below the signal line and the negative histogram bar is expanding.
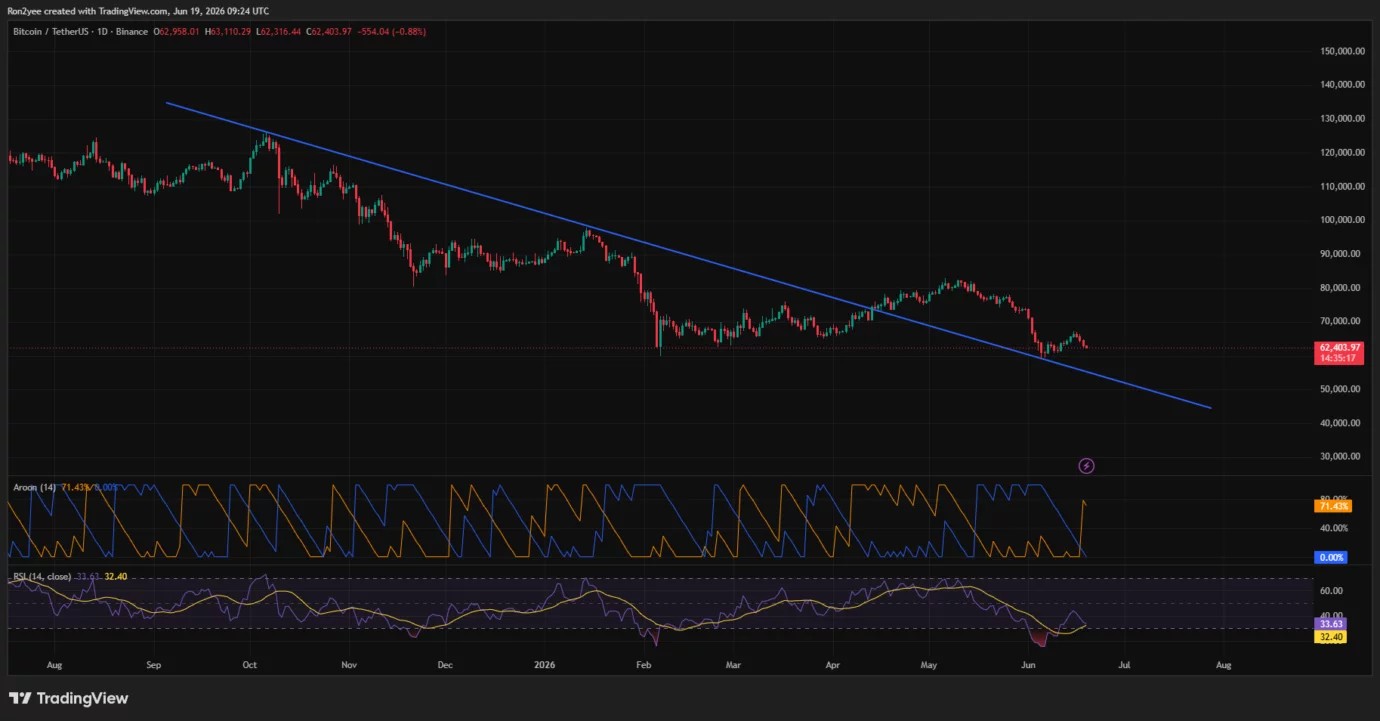
On the daily chart, Bitcoin continues to hold above the previous descending resistance trend line, which has now turned into support. As the asset price approaches the $61,000-$62,000 support zone, it remains important for bulls to hold on to its structure. While the daily RSI is around 34, the Aroon indicator shows a bearish advantage with downtrends above 70 and uptrends close to zero.
Commenting on this setup, cryptocurrency analyst Dern Crypto Trades pointed out that Bitcoin is trying to hold onto a major support area.
“The bulls need to hold in the $61,000 to $62,000 area or I think things will deteriorate quickly.”
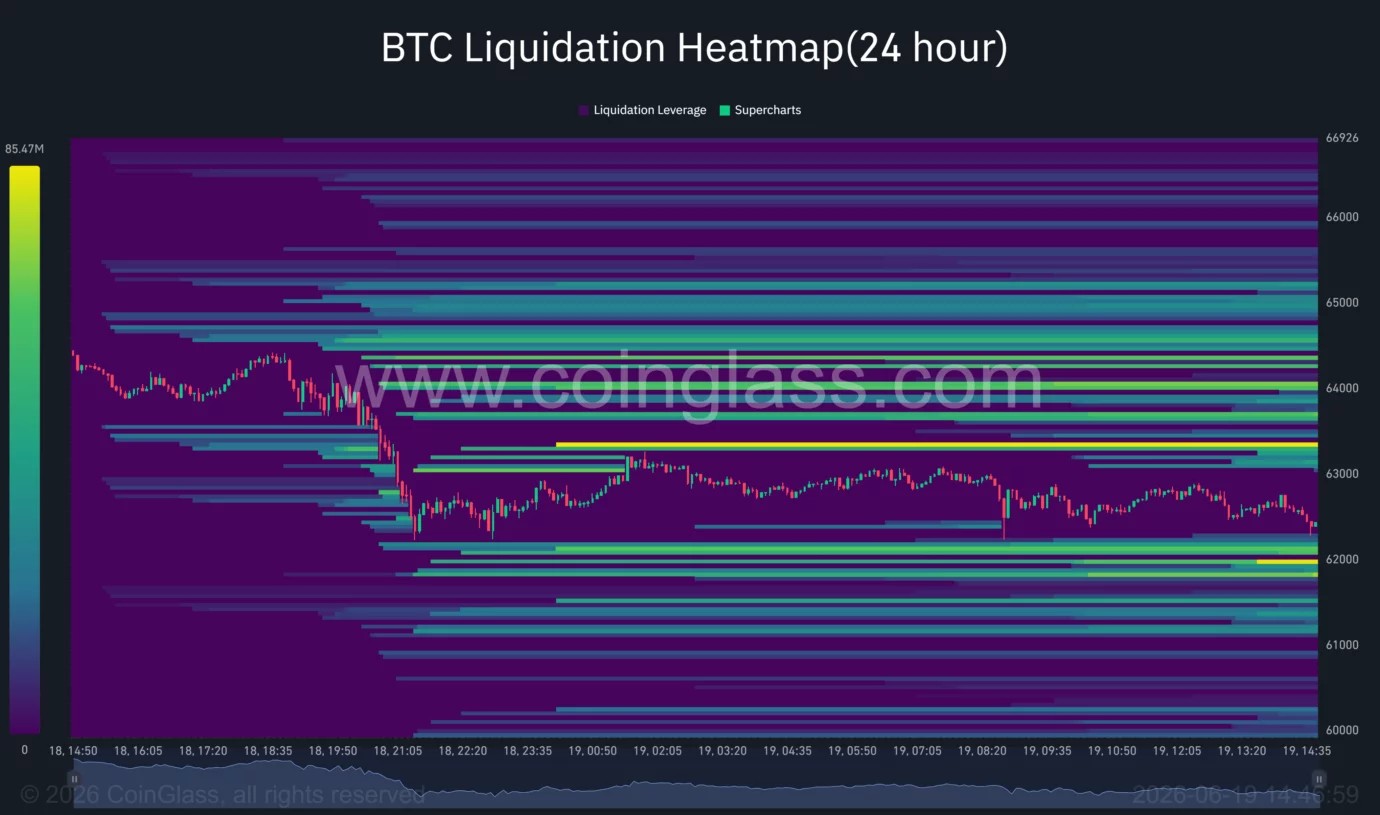
Liquidity data reveals why that zone is important. CoinGlass’ heatmap shows a dense cluster of liquidity between $63,500 and $65,000, with another concentration of liquidity around $62,100. A return to the top of the band could trigger a short-term liquidation, while a break below the band exposes new pockets of downside liquidity.
Bitcoin’s drop to around $62,300 hit a key liquidity goal, according to cryptocurrency analyst Renato Snyder. He noted that $60,500 represents the first area where a pullback could emerge, and a deeper price move below $59,000 would be a more attractive setup for a sustained reversal.
$BTC We cleared 62.3K of liquidity and achieved our goal.
As I mentioned yesterday, I had a short Bitcoin target of 62.3,000, and I was spot on.
For those of you who entered yesterday, it was clear that my momentum was slowing down, so I entered more aggressively around 64.3K.
I printed it… pic.twitter.com/aErwZwtxgh
— Lennaert Snyder (@LennaertSnyder) June 19, 2026
Failure to recover $65,000 could push the support zone lower
The main risk for bulls remains Bitcoin’s inability to regain overhead resistance. The 61.8% Fibonacci retracement level is located near $64,950, and the midpoint of the recent range is near $66,700. These levels coincide with significant clearing clusters identified on derivatives exchanges.
Another concern is the institutional position. Recent ETF outflows and continued capital rotation into technology and artificial intelligence stocks have reduced demand for Bitcoin at a time of heightened macro uncertainty.
should $BTC A loss of the $61,000 to $62,000 support area could cause traders to shift their attention to the June lows near $59,000. A decisive break below this level would strengthen the possibility of a deeper correction and refocus the long-term support zone in the mid-$40,000 region.