
Bitcoin is trading around $64,000, roughly midway through the $57,000 to $77,000 range that has defined the market since the Strait of Hormuz shock.
In a note, Can Luca Koymen, investment strategist at Cygnum, calls the current structure a catalytic structure.
“Absent a decisive catalyst, the path of least resistance is a range trade driven by positioning and flows rather than new spot demand.”
Angie Malltezi, Chief Operating Officer at Altius, agrees with this mechanism:
“Markets often spend long periods of correction before a catalyst emerges, and that catalyst is often one that investors were not focused on beforehand.”
Both set their first real inflection point late in the third quarter and cite the same reasons. The oil crisis, in which energy accounted for more than 60% of the consumer price increase in May, has not yet been reflected in the data.
According to Koymen,
“Energy shocks pass through inflation with a lag, so one soft reading will not reverse. A reading that truly reflects post-MOU normalization will realistically only appear in the August data, which is the print the FOMC will consider in September.”
He added that any real changes “will probably happen in the second half of the third quarter at the earliest.”
The data is still shocking.
CPI in May increased by 0.5% month-on-month and 4.2% year-on-year, while gasoline rose 7.0% month-on-month and 40.5% year-on-year.
In June, the Fed kept its target range for funds rates unchanged at 3.50% to 3.75%, saying inflation remained above its 2% target, partially reflecting supply shocks, including energy.
In the June Economic Forecast Summary, we raised our 2026 PCE forecast to 3.6% from 2.7% in March, and our core PCE forecast to 3.3% from 2.7%.
The Dallas Fed’s model shows that the oil crisis caused headline inflation to rise through the third quarter even in the one-quarter shutdown scenario, with headline inflation rising 0.6 percentage points and core inflation rising 0.2 percentage points quarter over quarter.
Koymen’s reading of the Fed’s stance has immediate significance for the calendar.
“This is now the Fed per print, and not just CPI, but core PCE as well, because that’s the Fed’s preferred metric. We should also expect less forward guidance going forward, which is what Chairman Warsh clearly signaled in his first meeting.”
If the Fed is reluctant to pre-commit, investors will not be able to lock in positioning based on forward guidance, each report that arrives will carry more weight, and the first truly clean report will arrive in August, increasing the incentive to pre-run market data.
OFAC issued Iran General License
The June CPI will be released on July 14th, but there are still traces of the shock period. The July CPI, to be released on August 12th, will provide for the first time clear information on whether energy costs are falling. The September FOMC will be held on the 15th and 16th, and the August CPI will be announced, but the August PCE, which will be announced by the BEA on September 30th, will not be announced.
| date | event | Why is it important for Bitcoin? |
|---|---|---|
| June 22nd | Launch of OFAC General License X | Begins 60-day oil flow normalization period |
| July 14th | June consumer price index | Still reflects the shock era |
| August 12th | July consumer price index | First clear reading on whether energy pressures are weakening |
| August 21st | OFAC license period expires | Key geopolitical risk nodes |
| August 26th | July PCE | For the first time, get an easy-to-understand look at the Fed’s recommended inflation indicator |
| September 11th | August consumer price index | Final report on major inflation before September Fed meeting |
| September 15th-16th | FOMC meeting | Fed has August CPI but not August PCE |
| September 30th | August PCE | Full approval expected after Fed meeting |
Maltej flagged this:
“September remains the most likely tipping point, but it is not an absolute constraint.”
He added that the Fed retains the authority to act between meetings if conditions warrant, but that it rarely does.
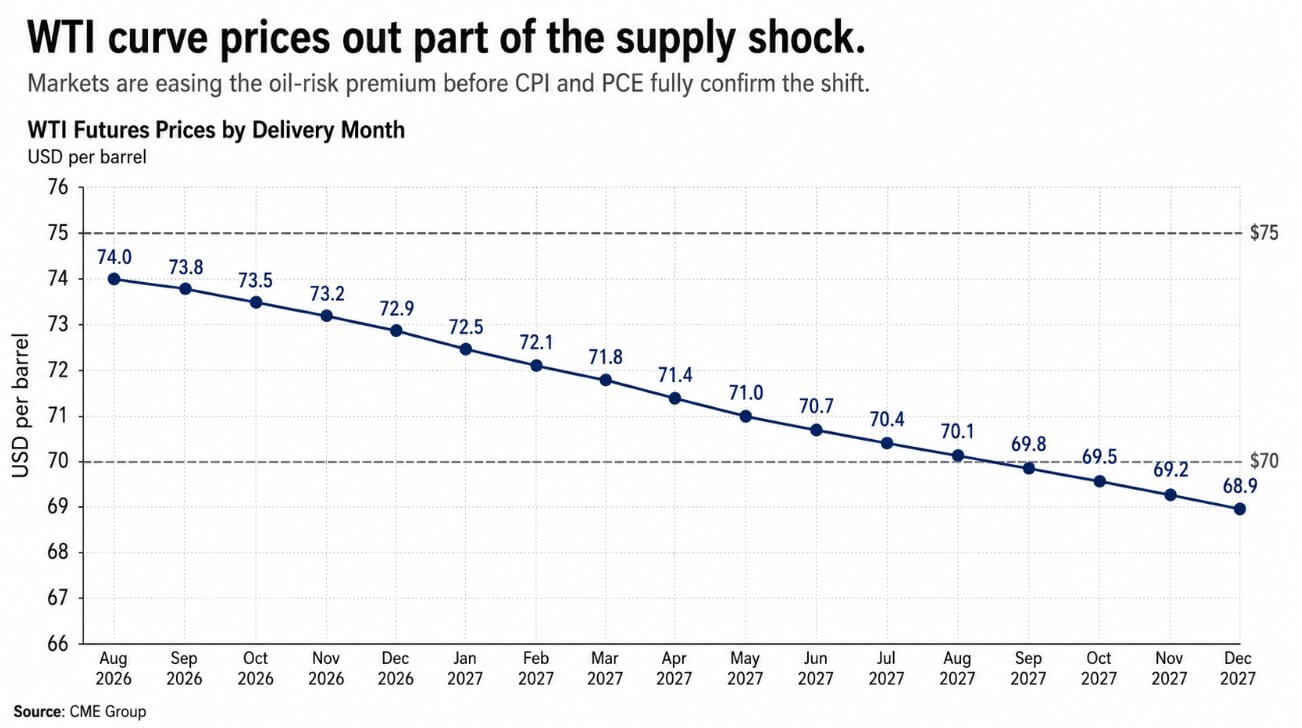
The oil curve already provides the answer.
The oil curve has already answered questions that CPI will take weeks to confirm, and Koymen reads the futures curve as a signal of where the base case lies.
“The futures curve has eased significantly, with most expiring WTI months below $75 and some 2027 contracts below $70. The market is pricing in a supply premium across the curve, not just at the front.”
Physical evidence supports the interpretation that some producers in the Middle East have reopened refineries and oil fields, which Koymen describes as a sign that “the parties on the ground are treating this as a permanent peace rather than a pause.”
Malltezi reads the broader asset response in the same way.
“Oil prices have regained much of their initial geopolitical risk premium and broad risk assets remain resilient, suggesting investors expect negotiations to continue without major escalation.”
The bailout has already been partially reflected in Bitcoin prices, with sources on both sides pointing to the mid-$60,000 range as the base case set out in the memorandum.
While the Aug. 21 deadline for OFAC’s license period is a tangible risk node, Koymen doesn’t see it as a hard cliff.
“Encouragingly, the US has signaled its intention to extend the deadline if a clear solution is not found by the deadline, which prevents the deadline from becoming a hard cliff. The risk of re-escalation is small, but not zero. It is that residual risk that keeps us hedging our positions rather than going outright long.”
Mr. Maltej also comments on asymmetry:
“While the market sees the likelihood of severe disruption as relatively low, it recognizes that a breakdown in negotiations could rapidly reprice energy markets and inflation expectations.”
Structural forces that maintain range
Koymen identifies new elements of Bitcoin income products that strengthen range-bound behavior even if the macro environment remains favorable.
He mentioned BlackRock’s recently launched Covered Call ETF (BITA), which could strengthen range-bound action, as the company sells call options on its holdings, effectively shorting the bull market.
Koymen added:
“This introduces a factor of repeat profit-taking on the upswing that was not present in previous cycles, and while still small compared to the spot ETF complex, it weakens the upside follow-through on the margin.”
BlackRock’s own risk disclosures confirm that writing covered calls on IBIT stock limits profits above the option’s strike price while leaving the fund exposed to downside risk.
He also cautioned that the market needs to see meaningful accumulation by professional investors through attractive entry-level ETFs, so investors need to monitor whether the demand really returns and whether scale accumulation materializes.
Koymen’s reading is that recent ETF outflows are more like profit-taking and macro risk avoidance than a structural exit, and outflow momentum has subsided at current levels.
Both conditions need to go together before Bitcoin has the fuel to break out of the range on its own.
Two paths through the data calendar
The bullish case is that the oil curve continues to normalize, July CPI and PCE show energy easing included in headline prices, and odds of a September rate cut increase before the Fed officially moves.
Federal funds futures currently price the probability of a September rate cut at about 52%, according to market forecasts from Signum. Mr. Koymen structured the channel as follows.
“Our base case is that if flows continue through Hormuz and improve further, the Fed will hold two to three meetings over the next few months.”
Still, he said Bitcoin could reprice based on expectations of easing before the Fed implements easing.
The bearish case is that the trajectory of inflation turns out to be more sticky than the oil curve alone indicates. EIA’s June Short-Term Energy Outlook forecasts Brent crude oil prices of $105 per barrel in June and July, with wholesale gasoline prices about 50% higher than pre-conflict benchmarks.
If gas and commodity prices continue to be reflected in core CPI despite oil easing, the Fed will hold for the long term, real interest rates will remain high, and Bitcoin will retest the floor.
Malltezi imposes honest constraints on predictions.
“It is very difficult to identify specific triggers in advance. Whether it is macroeconomic data, monetary policy, ETF flows, regulatory developments, or unforeseen events, until then, continuing to trade within the range remains a reasonable base case.”
| scenario | what must happen | Fed involvement | Impact of Bitcoin |
|---|---|---|---|
| Bull case: normalization on the market front | Oil curve continues to ease, July CPI/PCE shows energy easing, August 21st risk expands or eases | Even if the Fed maintains policy, the probability of a September interest rate cut increases | BTC will challenge or break through $77,000 upper limit |
| Base case: range persists | Oil is improving, but confirmation of inflation remains slow. ETF accumulation remains restrained | The Fed will hold two or three meetings in the future. | BTC is mostly traded internally $57,000 – $77,000 |
| For bears: the sticky inflation trap | Gasoline and commodity prices continue to drive inflation despite low oil prices | Fed will continue restrictive measures for a long time | BTC retested $57,000 lower limit |
| Tail risk: Deadline shock | OFAC period expires without extension or negotiation breakdown | Inflation expectations and rapid repricing of oil prices | BTC trades as a liquidity risk asset and loses range |
The CLARITY Act stands by in both scenarios. Koymen projects it to be about 50/50 for 2026, which is consistent with Polymarket’s odds of about 45% and the Senate Banking Committee’s vote in May, which advanced the bill 15-9.
Maltegi noted that the bill depends on the Congressional schedule and bipartisan support rather than geopolitical developments, and that any surprise passage would push the range up much faster than the oil and PCE order, arriving before most investors have set positions.
(Tag translation) Bitcoin