
Bitcoin’s rally above $60,000 faces new challenges from exchange flow and derivatives data after large holders moved one of the year’s biggest daily BTC inflows onto trading platforms during the recent selloff.
data from crypto slate The flagship digital asset was trading at $61,528 at press time, after falling below $58,000 to new bear market lows earlier in the week.
While the current price recovery has eased some immediate pressure, the market data behind this move suggests the recovery is less certain than prices alone would suggest.
Large deposits of Bitcoin indicate whale activity
Currency inflows into Bitcoin on June 30th became one of the clearest warning signs behind the recent market rally.
According to CryptoQuant data, approximately 49,000 BTC moved to the trading platform that day, one of the highest daily inflows recorded this year. Such spikes are closely monitored as they can precede sharp volatility, especially if they occur during a fragile recovery.
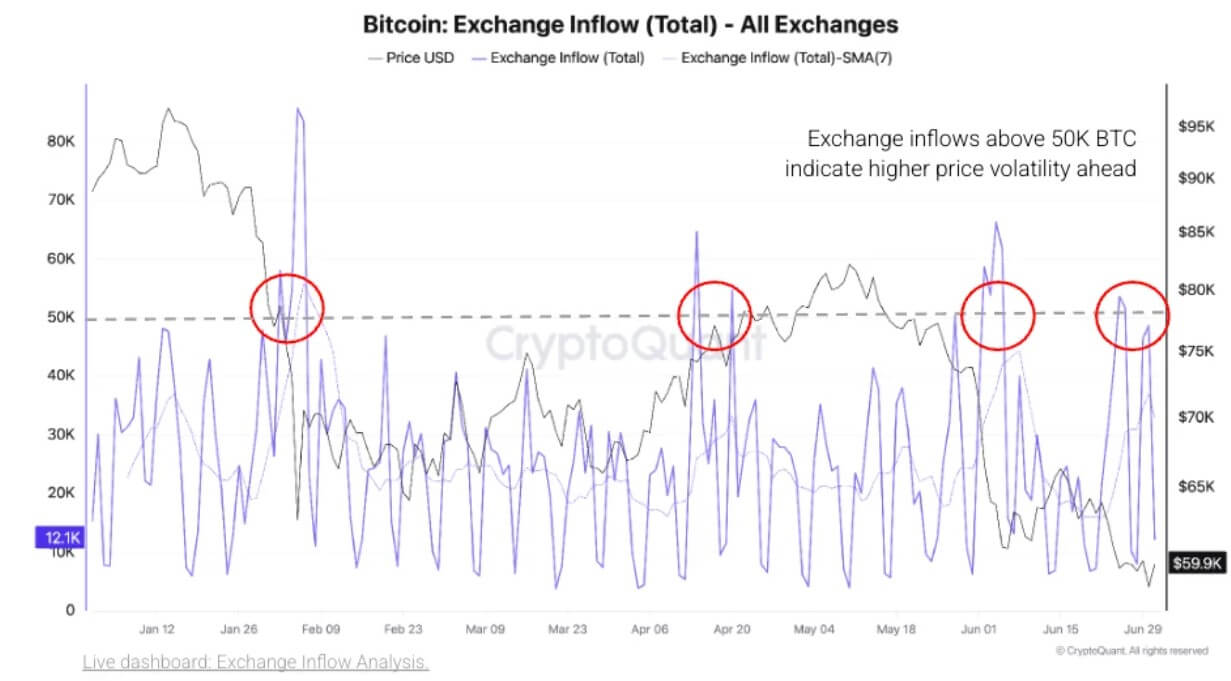
Exchange deposits may not be sold immediately. Investors can move their coins to a trading venue to rebalance their holdings, hedge exposure, post collateral, or prepare for derivatives activity.
Still, the transfers increase the amount of Bitcoin available on exchanges, putting the market at further risk if sentiment weakens or buyers fail to absorb the additional supply.
Meanwhile, the composition of the influx has heightened concerns. CryptoQuant reported that the average deposit size for Bitcoin doubled during the surge, increasing from about 1 BTC to about 2 BTC.
This shift suggests that the movement was driven by large holders rather than a broader wave of smaller retail transfers.
This distinction is important for traders monitoring liquidity. The increase in many retail deposits may reflect day-to-day exchange activity.
However, the jump in average deposits suggests more deliberate position changes by whales and institutional investors, and their transfers could weigh more heavily in an already thin market.
BTC rebound has not repaired the chart
Beyond capital flows, the Bitcoin price chart continues to show volatile conditions. The recent plunge below $58,000 caused significant technical damage that the current rally has yet to repair.
CryptoQuant reported that the asset recently fell below the neckline of a prominent head-and-shoulders pattern on the daily time frame.
Traders often read this bearish formation as a sign that an uptrend may give way to a downtrend. Although the price briefly regained the $60,000 level, this breakdown remains valid unless Bitcoin makes a sustained rally that invalidates the pattern.
Traders are now focusing on the $65,000 region as the next major battleground. However, previous support zones often become scary resistance levels during broader market corrections.
As a result, a corrective rebound towards $65,000 could provide attractive liquidity pockets for large holders to offload recently deposited exchange balances, effectively limiting further upside.
Futures buyers intervene, but leverage falls
Furthermore, a closer look at the derivatives data reveals that the recent price recovery lacks the characteristics of a sustainable bullish reversal.
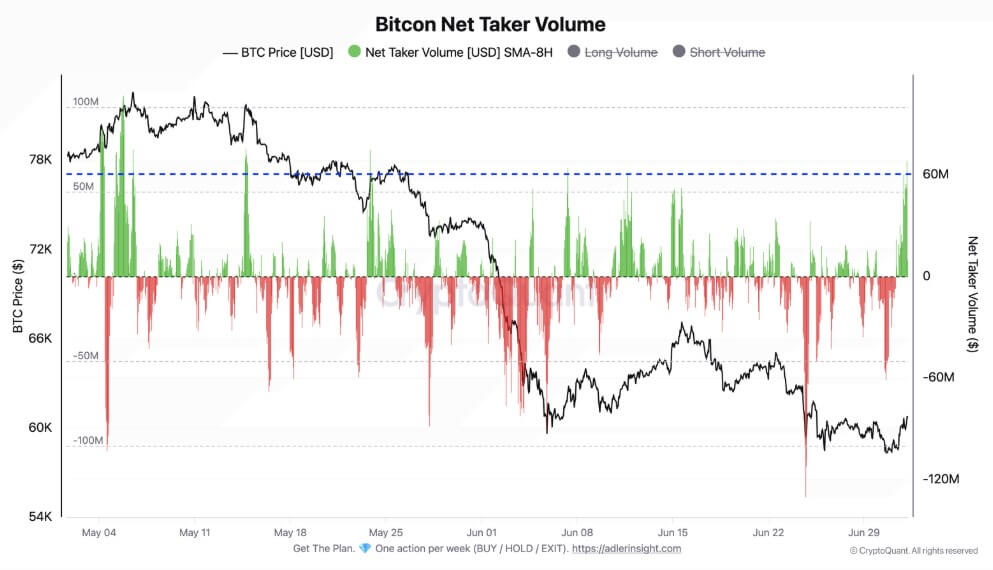
CryptoQuant analyst Axel Adler noted that BTC net taker volume, which tracks active buys minus sells in the market and smoothes the results with an 8-hour moving average, increased sharply after the June 30 plunge.
As Bitcoin fell towards $58,300, the indicator fell to around $-61 million, but reversed the next day due to increased buying pressure.
By July 2nd, net taker volume reached approximately $68 million as Bitcoin rose from around $58,000 to a local high near $64,000. This indicates actual market buying during a rebound, rather than just a passive rally.
However, BTC open interest moved in the opposite direction. The 24-hour change in Bitcoin open interest went from an increase of about 26,000 BTC at the beginning of July 1st to a decline of about 23,000 BTC by the morning of July 2nd.
As a result, total open interest decreased from approximately 368,000 BTC to a range of 342,000-346,000 BTC.
This divergence coincides with a short squeeze. Rising prices and falling open interest may indicate that hidden short sellers are buying back positions to avoid forced liquidations.
This type of move is driven by deleveraging rather than new long-term exposure, so support for a long-term uptrend may weaken unless new demand continues.
Liquidity remains a weakness
Compounding Bounce’s structural weaknesses is a notable drought in stablecoin liquidity, which is a major source of dollar-denominated purchasing power across centralized exchanges and on-chain markets.
crypto slate We previously reported that the stablecoin market recorded a rare contraction in the second quarter, further reinforcing signs that crypto liquidity is weakening beyond spot prices.
Stablecoins are an important source of purchasing power on centralized exchanges and on-chain markets, so a slowdown in new supply could make it difficult to sustain a rebound.
According to CryptoQuant, the Binance-linked USDT refresh rate Z-score was -1.81 recently, suggesting that new stablecoin liquidity is not coming into the world’s largest crypto exchange at the pace typically associated with strong demand.
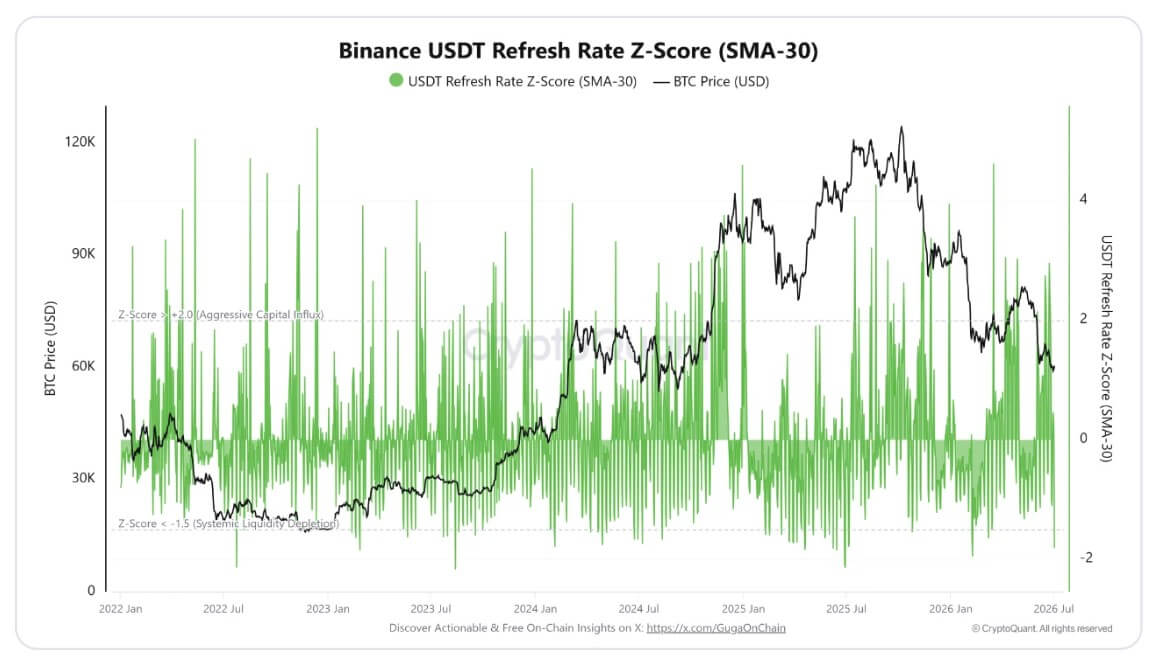
This puts even more pressure on existing buyers. If new dollar liquidity remains limited, Bitcoin may need sustained spot demand from current market participants to offset exchange inflows and prevent further declines below $60,000.
However, thin market liquidity can also magnify movements in both directions. While this can help drive prices higher quickly through a short squeeze, it can also leave the market at risk if large holders take advantage of the pullback and sell bullishly.
Bitcoin needs follow-through now
Bitcoin’s next move will depend on whether the market can turn the rebound into sustained demand rather than another short squeeze.
Sustaining above $60,000 would sustain the immediate recovery and give buyers more time to challenge the $65,000 area. A clean pass through this region would relieve pressure from the recent selloff and force traders to reevaluate their bearish chart settings.
However, if the rebound fails, the market will be exposed to supply closer to the exchange. A further drop below $60,000 could bring the realized price back into focus around $53,000, increasing the risk of extended losses to more holders.
For now, the market is showing two competing signals. Buyers returned after Bitcoin fell below $58,000, but whale currency flows, declining open interest, and weak stablecoin liquidity suggest a recovery still needs more evidence.
(Tag translation) Bitcoin