


Bitcoin continued its recovery this week, rallying towards a key resistance zone after rebounding from the recent swing lows near $57,700. The world’s largest cryptocurrency traded around $64,300, reflecting increased buying interest after weeks of pressure. Although short-term momentum has improved, traders still face some technical hurdles before confirming a broader trend reversal.
Resistance level is key
Bitcoin is currently trading above its 20-day exponential moving average, indicating improving short-term strength. However, it is still below the 50-day, 100-day, and 200-day moving averages. Therefore, buyers need to recover these levels before the overall market moves into a more bullish phase.
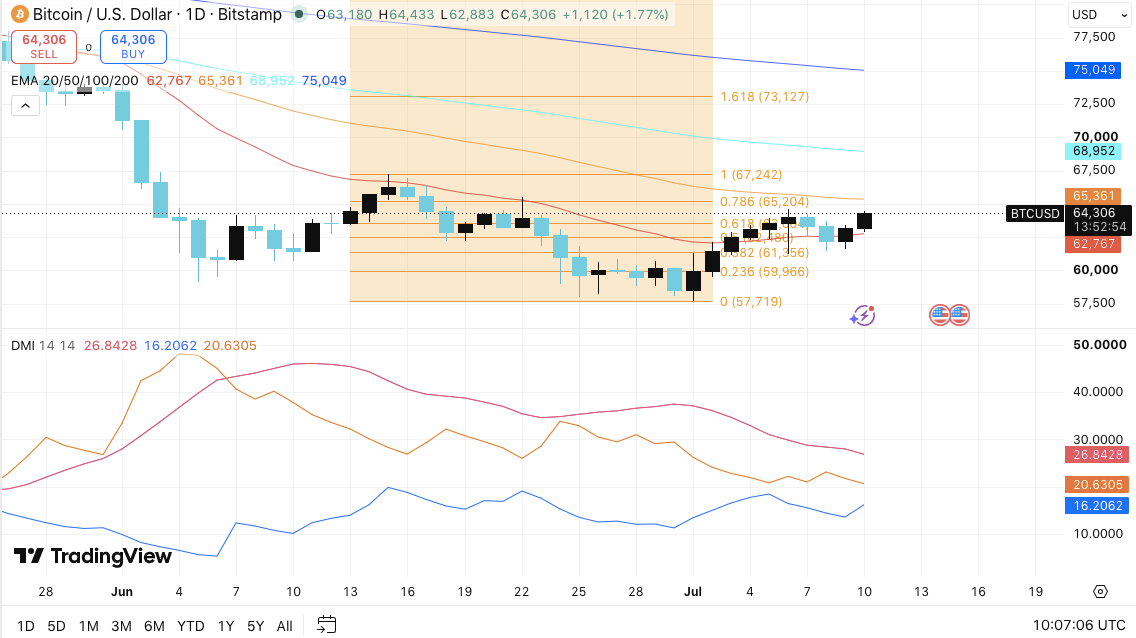
Immediate resistance lies near $64,500 and the 0.786 Fibonacci retracement near $65,200. Additionally, the 50-day EMA near $65,360 poses another major hurdle. If Bitcoin succeeds in breaking out of this area, it could head towards $67,200 and then $69,000. Beyond that, the 200-day EMA near $75,000 remains the primary long-term target.
Support levels are also clearly defined. The 20-day EMA around $62,800 is currently acting as the first zone of protection.
In addition to that, Fibonacci support levels near $61,800, $61,300, and $60,000 could limit downside pressure. Losing these areas would expose the previous swing lows near $57,700.
The Directional Movement Index also reflects changes in market structure. The bears maintain a slight advantage as the negative directional indicators are still outpacing the positive numbers.
Related: Ethereum Price Prediction: Can ETH Extend Rise towards $1,955?
However, the gap continues to narrow, indicating that the selling momentum has weakened considerably. Additionally, ADX near 27 suggests that the current trend remains meaningfully strong.
Derivatives and currency data reflect cautious optimism
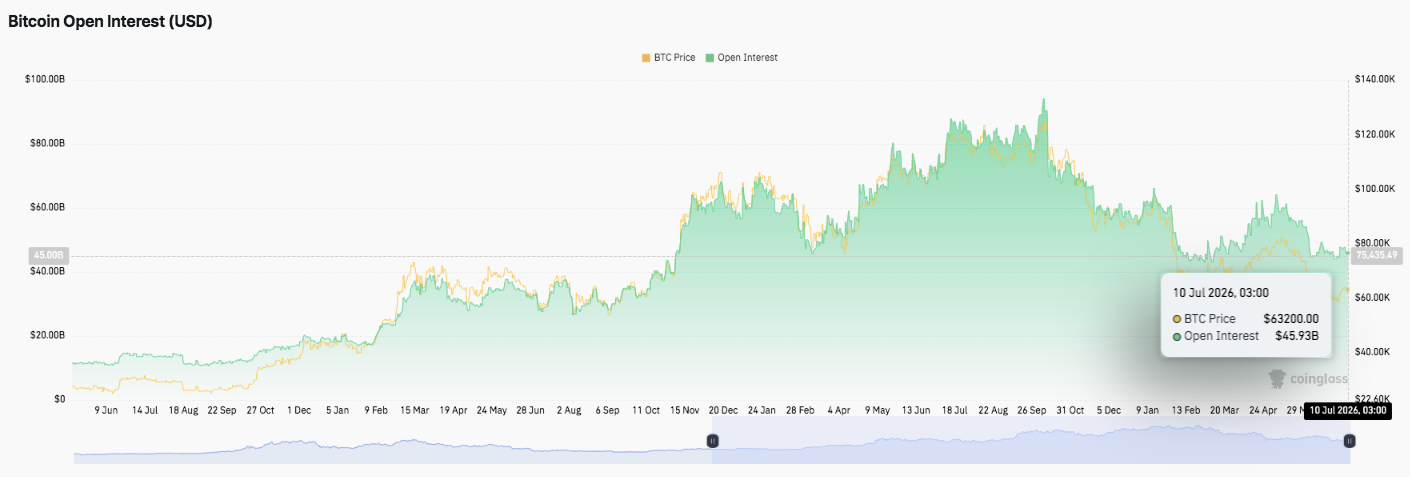
The Bitcoin derivatives market has cooled significantly in recent weeks. Open interest fell from over $90 billion to about $45.9 billion. This decline suggests that traders are unwinding leveraged positions through liquidations and profit taking. Nevertheless, current levels remain well above historical lows, highlighting the continued participation of institutional investors and retailers.
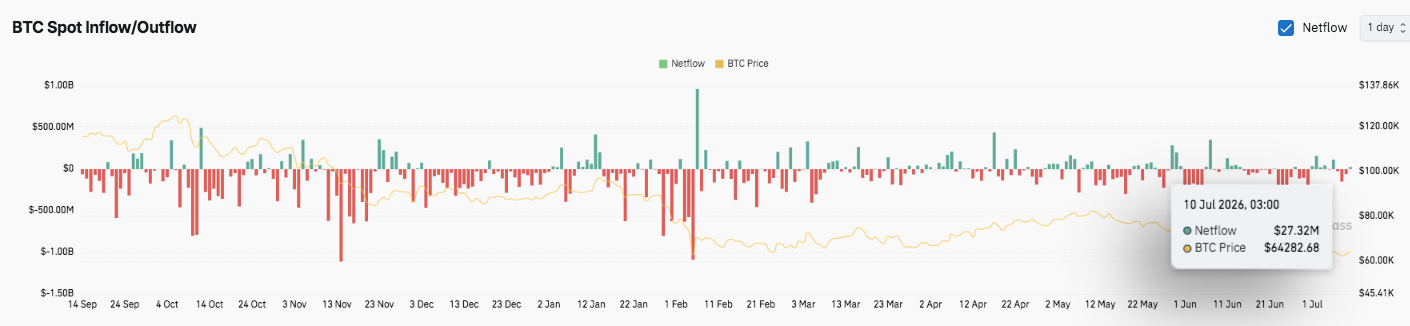
Spot exchange activities also paint a balanced picture. Early periods recorded large withdrawals, including some in excess of $500 million and some in excess of $1 billion. These movements indicated that investors were accumulating Bitcoin by transferring it to private wallets. Recently, foreign exchange inflows and outflows have decreased, and foreign exchange flows have stabilized.
Related: $XRP Price prediction: $XRP Do you want to set a 1,000% move or just retest the same resistance?
The latest net inflows of approximately $27 million indicate limited sales activity rather than active distribution. Therefore, Bitcoin appears to be entering a consolidation phase, and rising demand could fuel a move in the next direction.
Technical outlook for Bitcoin price
Key levels remain in focus as Bitcoin looks to consolidate its recovery.
Top level: $64,480 is the first resistance followed by the important $65,204 to $65,361 breakout zone. A sustained move above this area could accelerate the rally towards $67,242, with $68,952 (100-day EMA) and $73,127 potentially emerging as the next upside targets.
Lower price level: Initial support is at $62,767 (20-day EMA), followed by $61,826 and $61,356. If selling pressure increases, Bitcoin could revisit $59,966, but $57,719 remains a key swing low that bulls must protect.
Upper limit of resistance: The 100-day EMA at $68,952 remains a major barrier before Bitcoin challenges the long-term resistance at the 200-day EMA near $75,049.
The broader technical structure shows Bitcoin recovering from recent lows while trading between major moving averages. Although momentum has improved, a decisive breakout of the $65,200-$65,400 resistance cluster is required to confirm a sustained bullish reversal.
Will Bitcoin go up?
Bitcoin’s near-term outlook depends on whether buyers can convert the $65,200 to $65,400 resistance zone into support. A successful breakout with increased open interest and strength in spot demand could pave the way for a rally towards $67,200 and $69,000, after which higher targets could become the focus.
However, failure to overcome this resistance could trigger a further consolidation period or a pullback to $62,800 with $61,300 and $60,000 acting as the next major support zones.
Related: Velvet Price Prediction: Bullseye $0.54 Breakout Sends Velvet Price Up 30%
Currency flows indicate that selling pressure has eased, and falling open interest indicates that excess leverage is being washed out of the market. Taken together, these factors point to a healthier market structure, but strong buy conviction is still required for Bitcoin to ensure its next sustained advance.


