


Ethereum price fell as much as 3.5% to $1,820 on July 17, after recent gains stalled below $2,000 and weak Democratic support for the Clarity Act hurt overall crypto market sentiment.
According to data from crypto.news, Ethereum ($ETH) It has since recovered to around $1,835, but sellers have erased most of the gains recorded earlier this week when it rose to $1,940. Politico’s reporting that Senate Democrats currently do not support the market structure bill reduces its chances of securing the 60 votes needed for passage.
Democratic lawmakers have called for limits on conflicts of interest related to President Donald Trump’s cryptocurrency holdings before supporting the bill. Analysts currently give the bill less than a 30% chance of passing this year, according to Barron’s, but Congress faces a narrowing window of time before recessing in August.
At the same time, more than $400 million in leveraged cryptocurrency positions were liquidated in the past 24 hours, according to Coinglass data.
3 days of CoinGlass $ETH The liquidation heatmap shows a cluster of leverage around $1,800 to $1,810, a zone that sits just below Ethereum’s current price. On the upside, the liquidation cluster is found around $1,845 to $1,860, with the largest overhead concentration seen around $1,950 to $1,960.
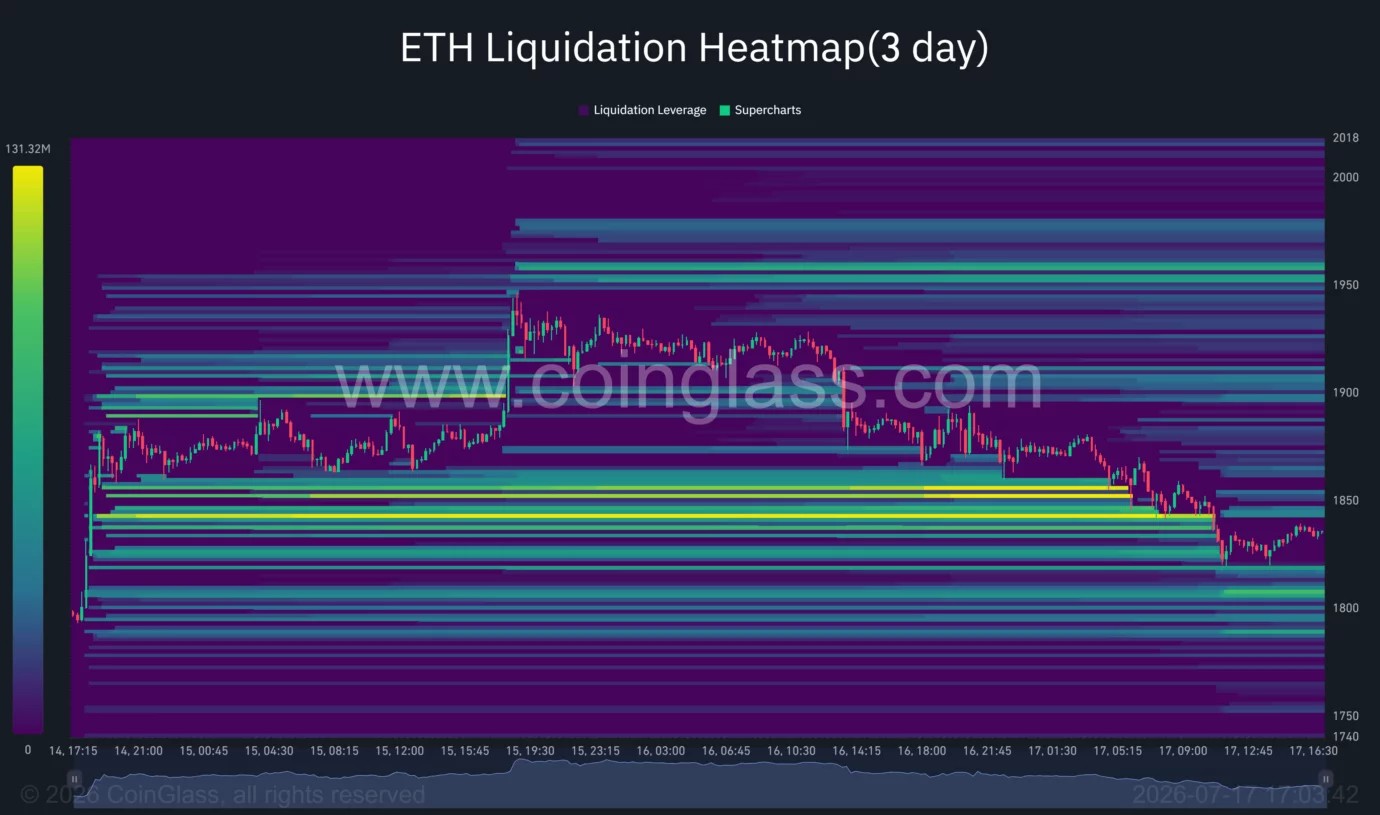
Therefore, a break above $1,860 could accelerate towards $1,950, but a break below $1,800 could trigger another wave of long-term liquidations.
Spot Ethereum ETFs in the US offer only limited support. The fund attracted $84.42 million in the week ending July 11, ending eight consecutive weeks of net outflows, while Fidelity’s FETH recorded $15.4 million in withdrawals on July 13. Therefore, ETF demand remains uneven. $ETHhas recovered from its lows of around $1,500 in late June.
Economic indicators came under pressure after the number of new jobless claims fell to 208,000, the lowest level in two months. Some economists are raising their second-quarter growth forecasts to as much as 2.4%, after June retail sales rose 0.2% and core sales rose 0.5%.
These numbers dampened hopes for aggressive interest rate cuts by the Federal Reserve. The 10-year Treasury yield rose to 4.596% and the 2-year Treasury yield reached 4.179%, increasing the opportunity cost of holding risky assets such as Ethereum.
Ethereum needs to recover $1,875 before another $2,000 test
Ethereum’s daily chart shows that the rally lost momentum after reaching around $1,940. $ETH It then returned to the $1,832 breakout level that was capped by several recovery attempts in June and early July.
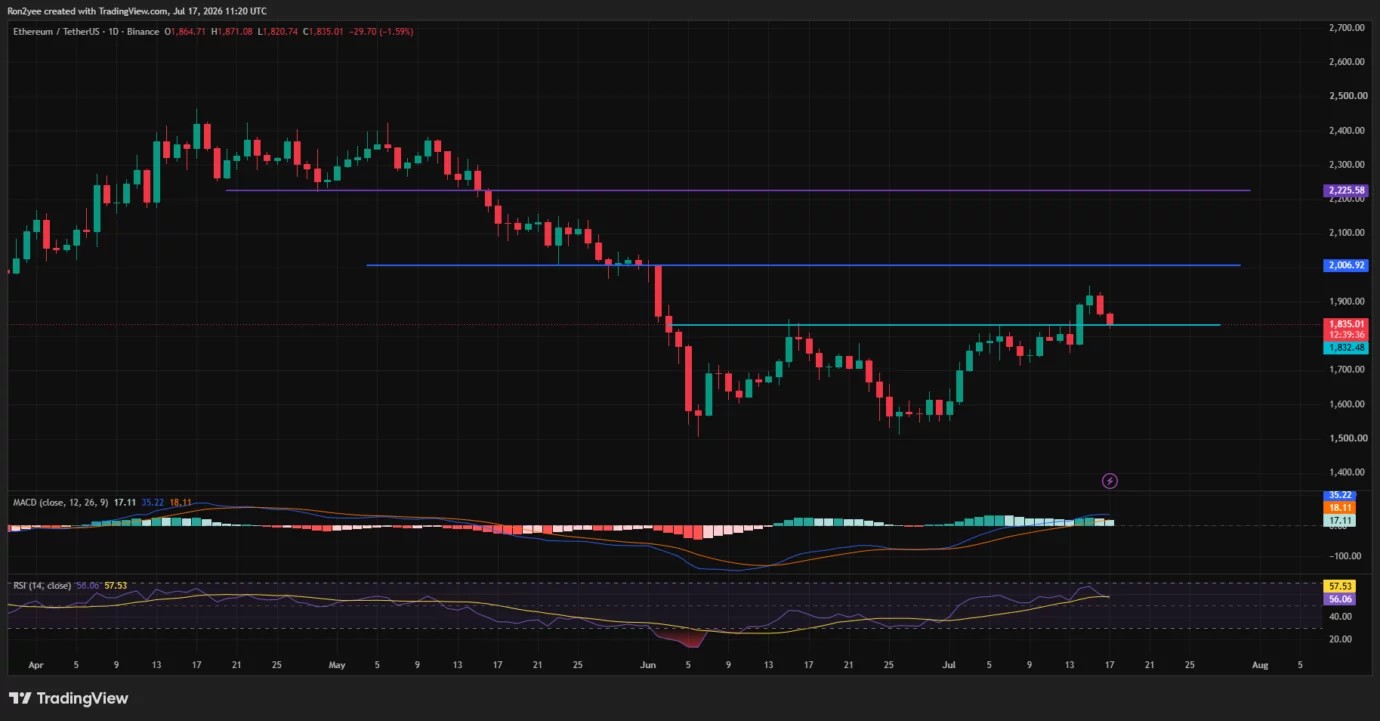
Day-to-day momentum is still positive but starting to weaken. The MACD line is at 35.22 against the signal line at 18.11 and the histogram is still above zero at 17.11. The Relative Strength Index has fallen to 56.06 and is now below the moving average of 57.53, indicating that buyers are losing some control without pushing. $ETH To bearish momentum.
On the 4 hour chart, $ETH It fell below the Bollinger Band midpoint at $1,874. The lower band around $1,796 currently forms the next volatility-based support, while the upper band at $1,952 sits just below the psychological $2,000 wall.
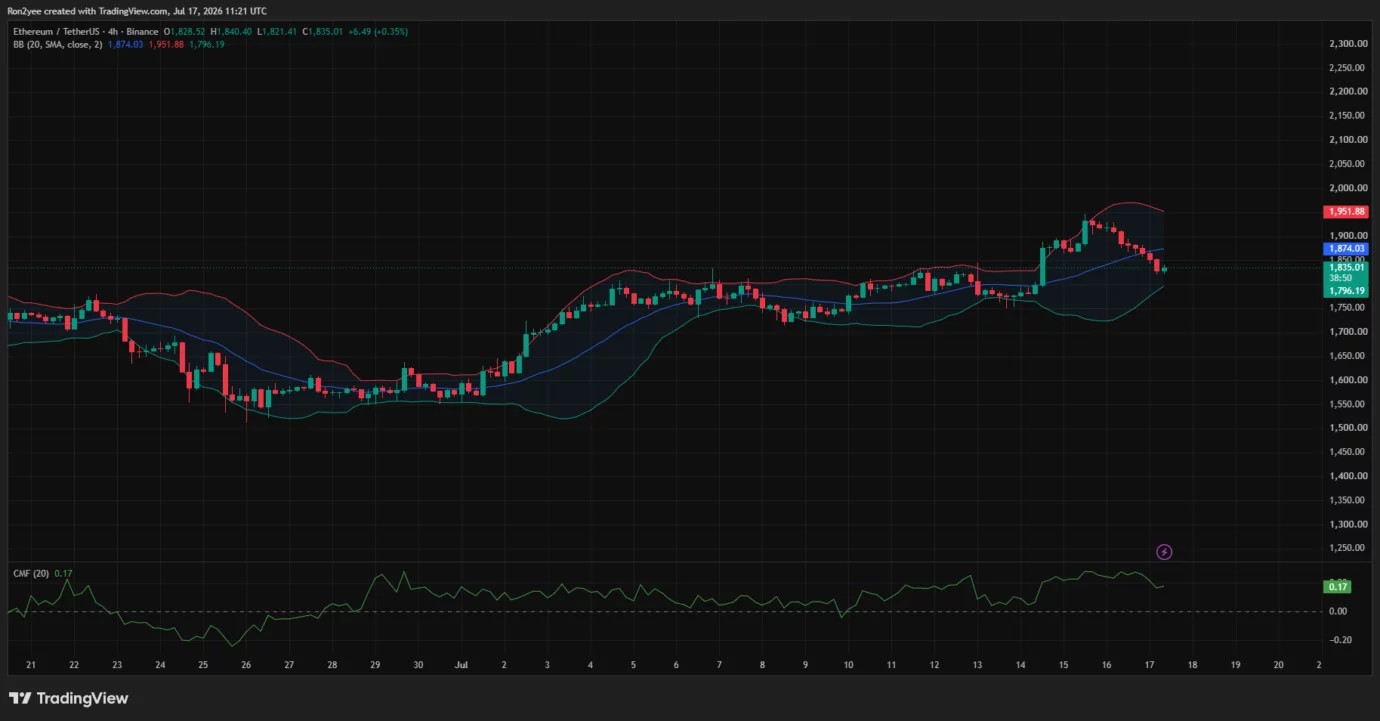
Chaikin Money Flow remains positive at 0.17, indicating that capital has not completely flowed out of the market. The buyer must collect $1,875 and then clear the $1,940 to $1,952 area. $ETH You can try Daily Resistance for $2,006. A close above this level will expose the next major chart wall near $2,225.
Recovery is at risk if price closes below $1,800
Ethereum has entered a key support zone after giving up recent gains, according to analyst Ted Pillows.
“The daily closing price should be above $1,850, otherwise Ethereum will lose all short-term gains.”
If the price cannot sustain the $1,800-$1,832 area, the bearish trend will strengthen and the lower 4-hour Bollinger Band around $1,796 will be exposed. Below that, the daily structure leaves room for a decline towards $1,715, followed by the June support area between $1,550 and $1,600.
Therefore, a bullish case calls for a close above $1,850 and a subsequent recovery to $1,875. Continued ETF withdrawals, rising Treasury yields, new tech losses, and further delays to the CLARITY Act will invalidate that path and keep $2,000 out of reach.


