
On-chain data shows that the Bitcoin mining hashrate has seen a notable increase since its mid-March lows, a sign that miners are coming back.
Bitcoin hashrate significantly recovers from previous decline
“Hashrate” refers to a metric that tracks the amount of computing power that miners have connected to the network. This is measured in hashes per second (H/s), or more practically exahashes per second (EH/s). This indicator serves as a proxy for sentiment among miners. Its rising value may suggest that on-chain validators are finding the network profitable to mine, while its falling value may suggest that this cohort is moving away from the chain for now.
As the chart below from Blockchain.com shows, the seven-day average value of Bitcoin hashrate witnessed a drawdown in the first half of March.
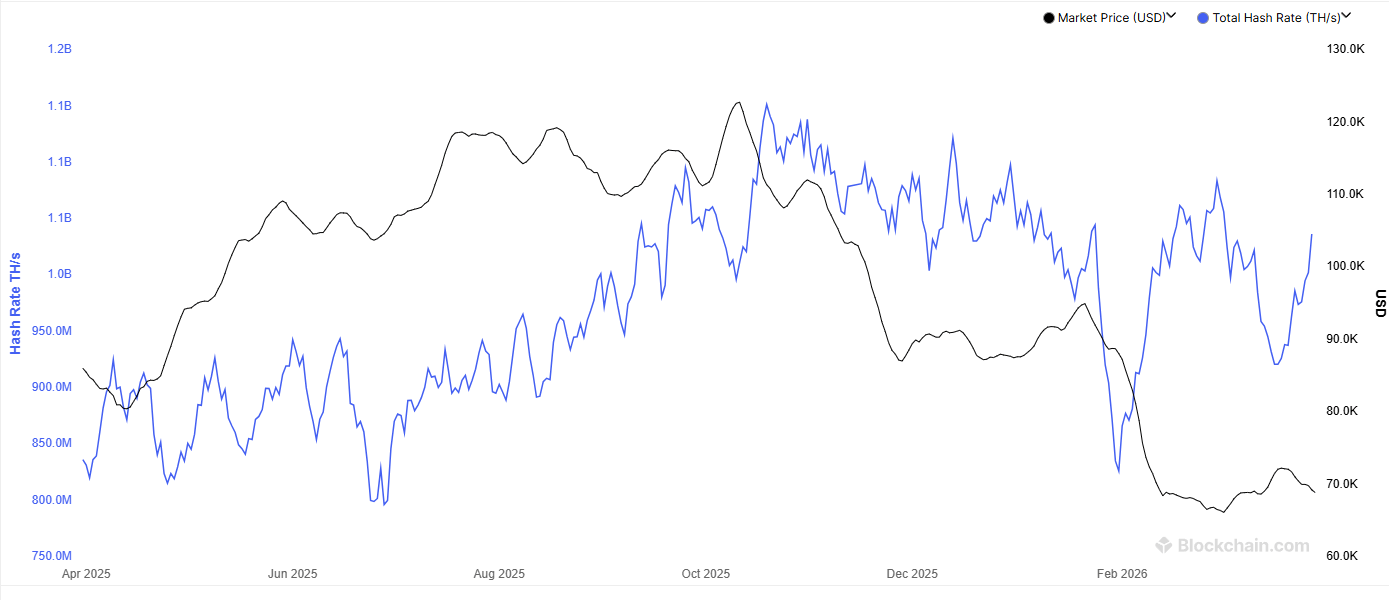
The value of the metric seems to be increasing rapidly in the last few days | Source: Blockchain.com
Interestingly, the decline in this indicator $BTCspot price. Miners often tend to track the value of cryptocurrencies as their returns are directly correlated to their value. However, this time there was a discrepancy between the two.
Some have speculated that this decline may be due to the changes the mining industry has been observing recently, with many large public mining companies choosing to focus on emerging AI/data center businesses. However, since the bottom of 920.8 EH/s on March 19th, the hashrate has recovered significantly, casting doubt on the theory.
The 7-day average hashrate is currently 1,036.6 EH/s, up about 12.5% from the low seen at the beginning of the month. The indicator has not yet returned to its March 1 high of 1,083.9 EH/s, but a full recovery could occur if the recent trajectory continues.
However, it remains to be seen how the hashrate will develop in the near future, given the uncertainty during the war and the consolidation phase that Bitcoin was stuck in during the miner push towards AI.
In other news, Bitcoin spot exchange-traded funds (ETFs) previously observed continuous positive net flows, but that trend has broken in recent weeks, according to data from SoSoValue.
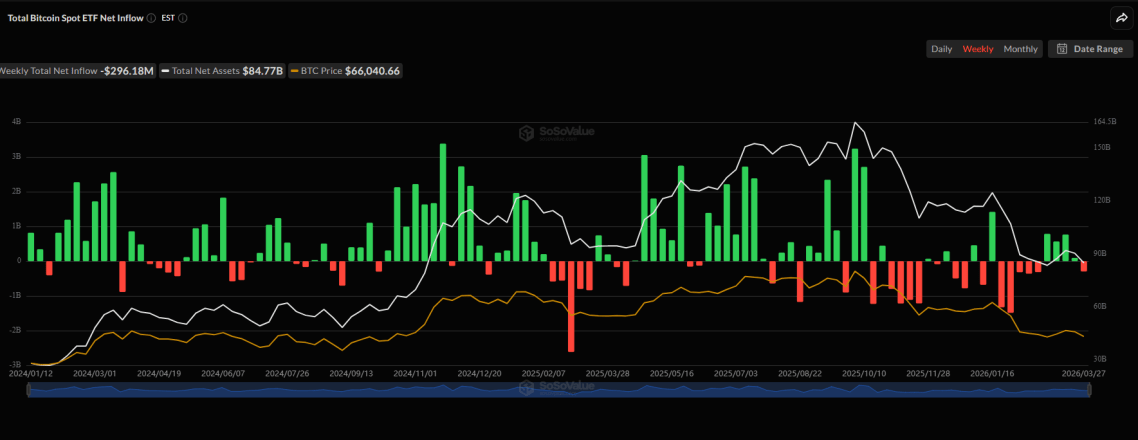
US weekly net flow data $BTC Looking back at the history of ETFs | Source: SoSoValue
As shown in the graph above, US Bitcoin spot ETFs have recorded net inflows for four consecutive weeks to the latest ETF, suggesting demand is flowing into the cryptocurrency through these funds. But last week, the trend reversed as more than $296 million in capital flowed out of the fleet instead.
$BTC price
At the time of this writing, Bitcoin is trading around $67,600, down nearly 5% over the past week.
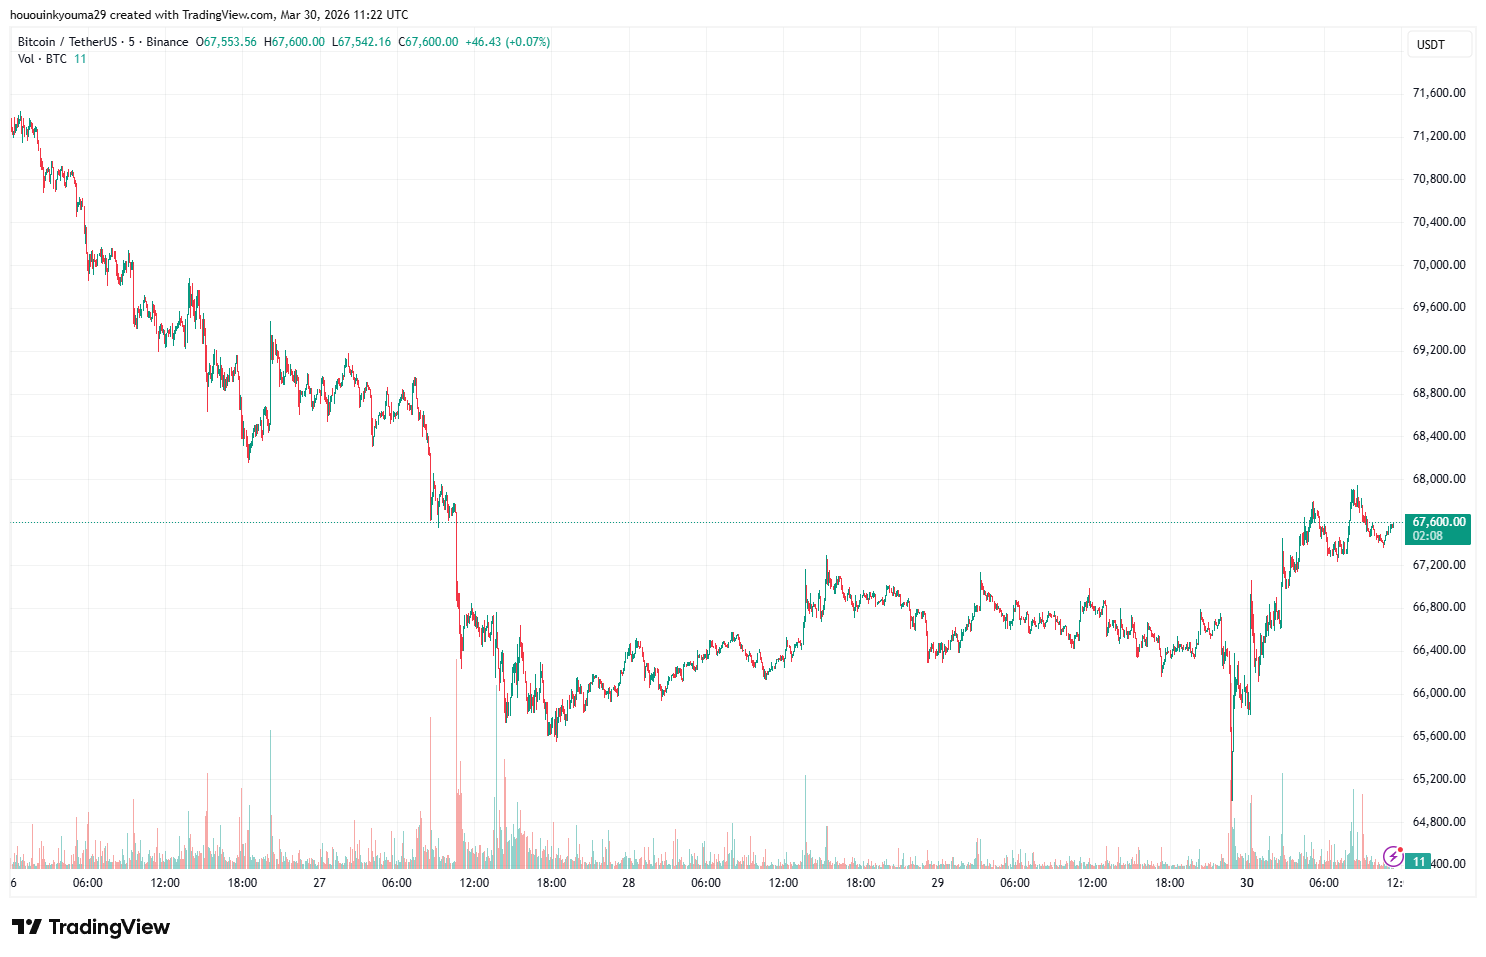
Coin price trend in the past 5 days | Source: BTCUSDT on TradingView
Featured image from Dall-E, chart from TradingView.com