
Bitcoin prices have remained in a narrow range this week, with a decline in the Coinbase Premium Index pointing to further downside as institutional demand wanes.
summary
- Bitcoin price is forming a bearish pennant pattern on the daily chart.
- The Coinbase Premium Index remains in the red, indicating weak demand from the US.
- Futures open interest continues to decline this month.
Bitcoin ($BTC) traded at $67,420 on Wednesday, down slightly from last weekend’s high of over $70,000. It was down double digits from its all-time high of $126,300.
One of the big risks facing Bitcoin is that institutional demand in the US has declined significantly, which explains why the Coinbase Premium Index has remained in the red throughout this year. Coinbase is the most preferred platform for Bitcoin investing by American investors.
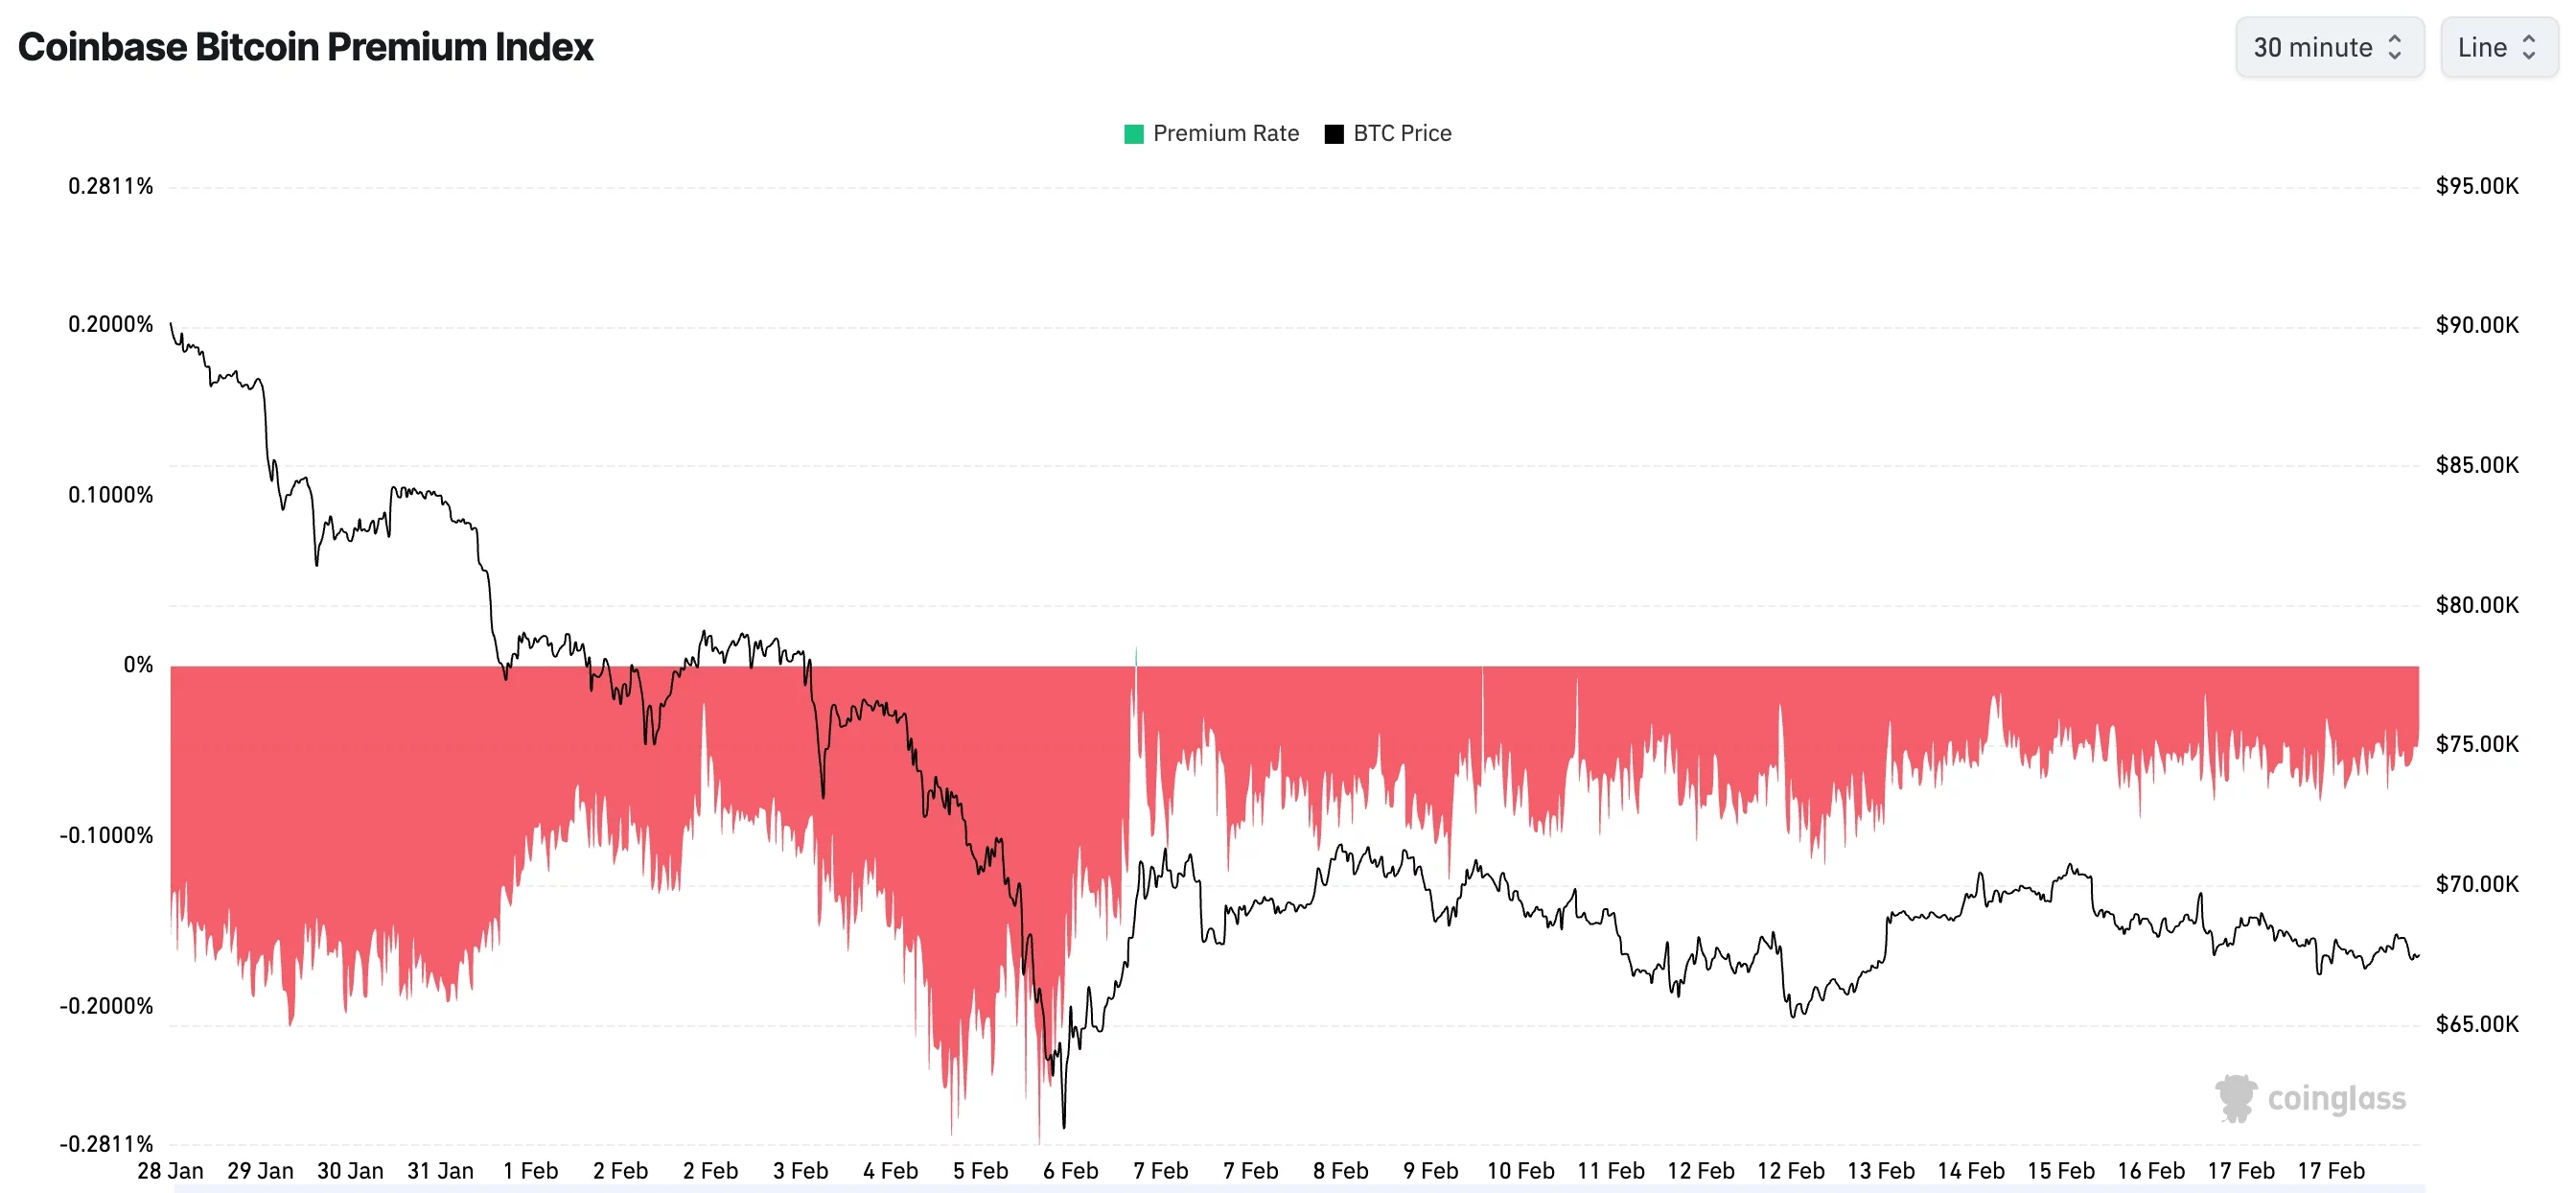
Coinbase Premium Index |Source: Coinglass
Moreover, only a handful of Bitcoin treasury companies are accumulating Bitcoin as much as last year. Strategy continued to buy Bitcoin last week, bringing its total holdings to more than 717,000. Bitcoin America and Strive also bought Bitcoin this year.
You may also like: Altcoin spot selling pressure reaches 5-year high at -$209 billion
Meanwhile, data from SoSoValue shows that spot Bitcoin ETF outflows have skyrocketed in the past few months. All of these funds have shed more than $8 billion in assets since October of last year, and the trend continues.
According to Bloomberg, Financial institutions have largely given up on using Bitcoin because it fails to act as a hedge against inflation and stock market stress. Nor does it serve as a hedge against currency depreciation.
Bitcoin futures open interest has continued to fall over the past few months and currently stands at $44 billion, down significantly from last year’s high of more than $95 billion. Additionally, demand for borrowing exposure to CME has remained subdued over the past few months.
Technical analysis of Bitcoin price suggests a crash
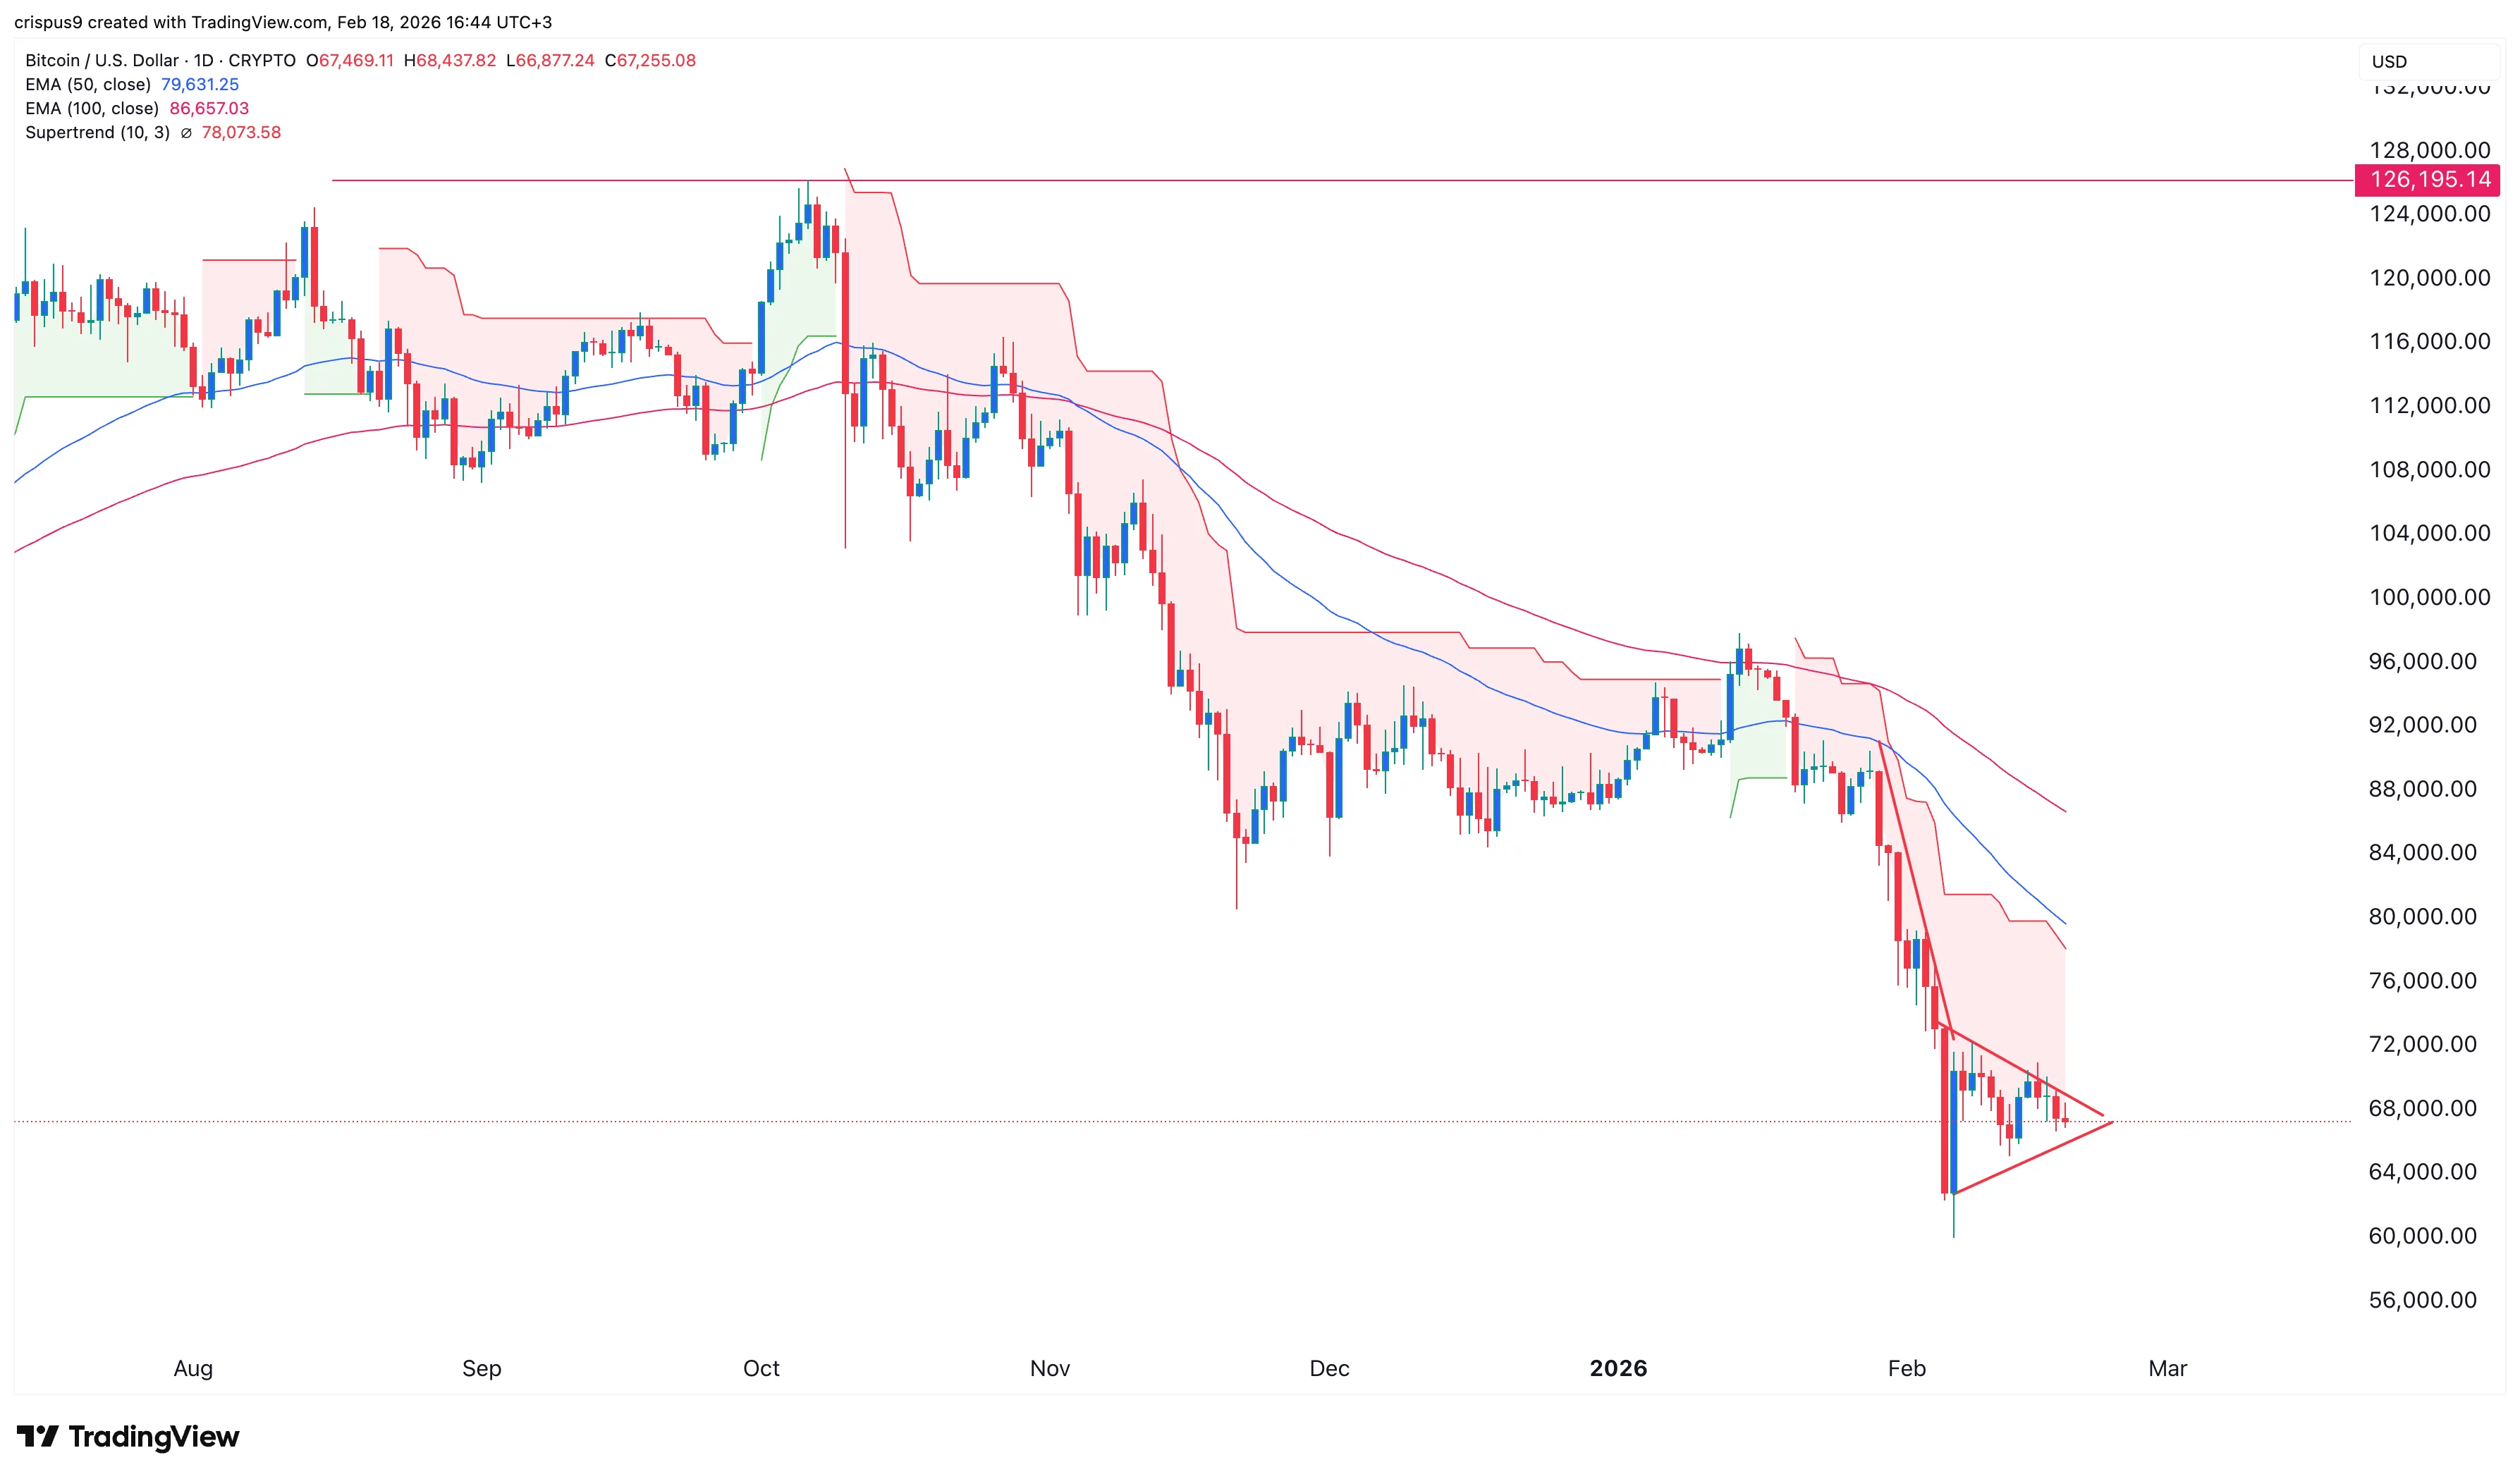
$BTC Price list |Source: crypto.news
The daily timeframe chart shows that Bitcoin price is flashing red flags. For example, the coin is slowly forming a large bearish pennant pattern. The vertical lines have already been formed, and the triangular parts are currently being formed.
The Supertrend indicator has remained red since January 19th of this year. It also remains below the 50-day and 100-day exponential moving averages.
Therefore, the coin will likely continue to fall, with an initial target of $60,000, the lowest price since the start of the year. A break below this level could signal further downside, reaching the psychological level of $50,000, as Standard Chartered analysts predicted last week.
read more: MYX closes strategic funding round led by ConsenSys