
Bitcoin ($BTC) is gaining momentum on the 4-hour chart while continuing to trade in a tight range as traders monitor key levels for direction. The price is hovering around a consolidation base near the mid-$60,000 zone, and this structure indicates that the market is preparing for a decisive move. Additionally, while short-term indicators are showing early strength, broader trend signals are yet to be confirmed.
Market structure and momentum signals
Bitcoin is currently showing a sideways structure with a slight bullish bias on the 4-hour time frame. Price rebounds from the $66,000-$67,000 base and serves as an immediate support cluster.
Additionally, the 20 and 50 exponential moving averages are compressed, which often indicates that volatility expansion is coming. Therefore, traders are expecting a strong directional move soon. However, Bitcoin is still trading below the 100 and 200 EMAs, limiting confirmation of a full bullish trend.
Moreover, momentum remains mixed as price tests the upper pressure of the Bollinger Bands. This behavior indicates a growing desire to purchase, but it also warns of a possible rejection reaction, bordering on resistance. The current structure therefore reflects a coiled market poised for market expansion rather than a continuation of a clear trend.
Key support and resistance levels
Bitcoin is facing strong support between $67,400 and $67,000, where recent price movements have been stable. Below that, the $66,600 to $66,300 zone coincides with the 0.236 Fibonacci retracement level.
Additionally, the $65,800 to $65,200 range serves as the primary structural support. A break below $65,000 could accelerate selling pressure and pave the way for $63,000 to $60,000.
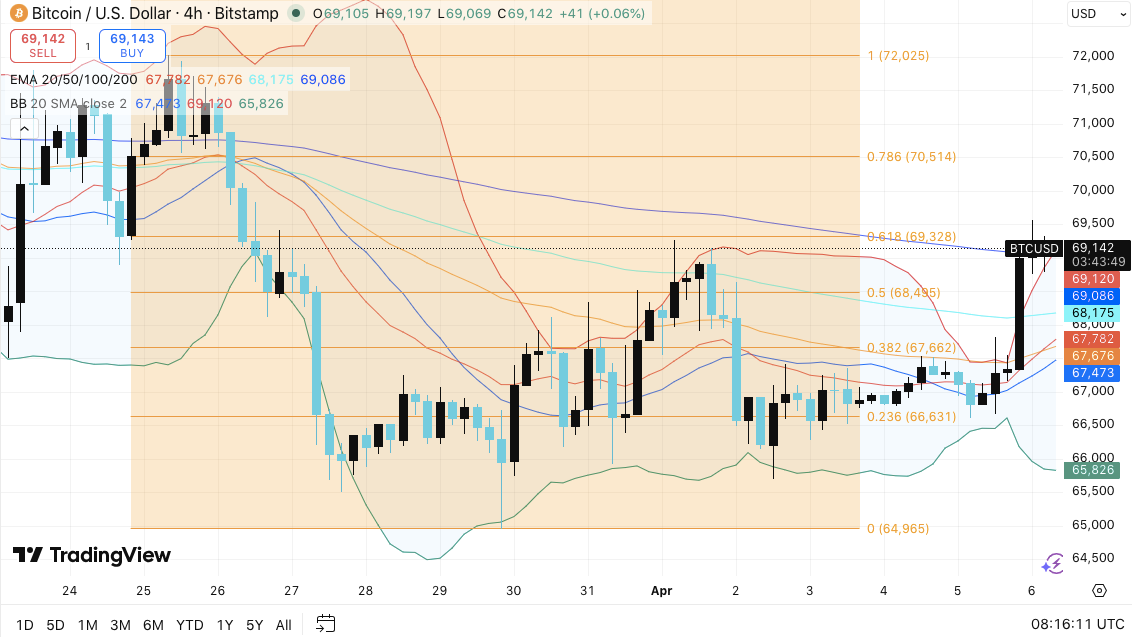
On the upside, resistance begins at $68,400 to $68,500, followed by $69,300, which corresponds to the 0.618 Fibonacci level. Importantly, this zone serves as a key decision point for traders.
Related: siren price prediction: SIREN falls 67% — can bulls regain $0.60?
if $BTC Above $70,500, aim for $72,000 and potentially grow toward $75,000-$78,000. However, if it is rejected around $69,000-$70,000, the price is likely to remain within the current range.
Open interest and spot flow dynamics
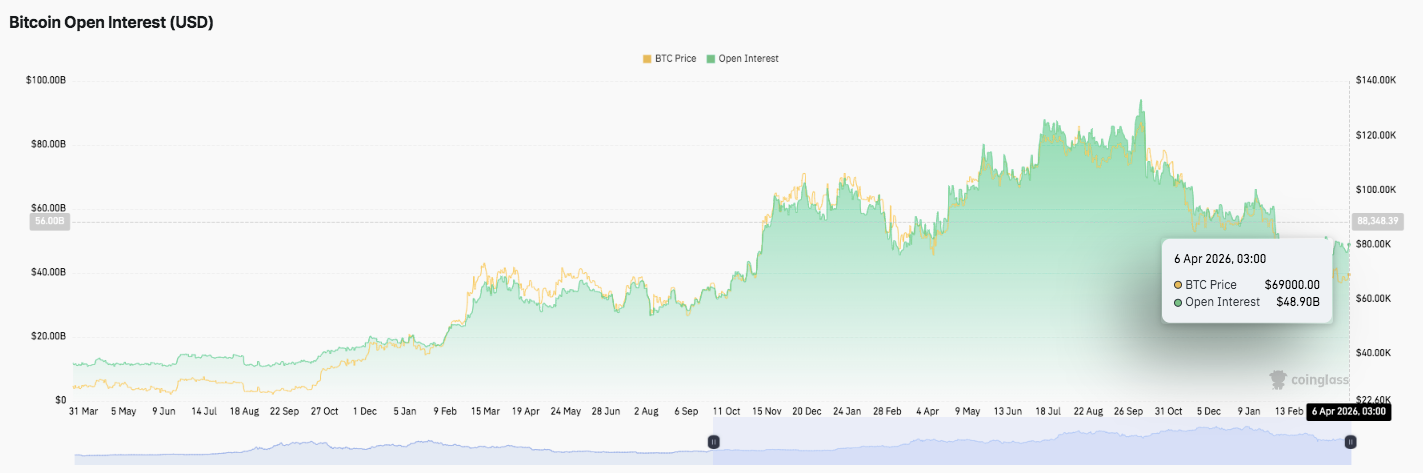
Open interest data shows expansion during price increases, supporting increased leverage participation. Additionally, increased open interest often supports upward momentum, especially during breakout attempts.
However, the recent decline in open interest suggests a cooling phase where active speculation decreases. Therefore, traders may wait for stronger signals before re-entering the market.
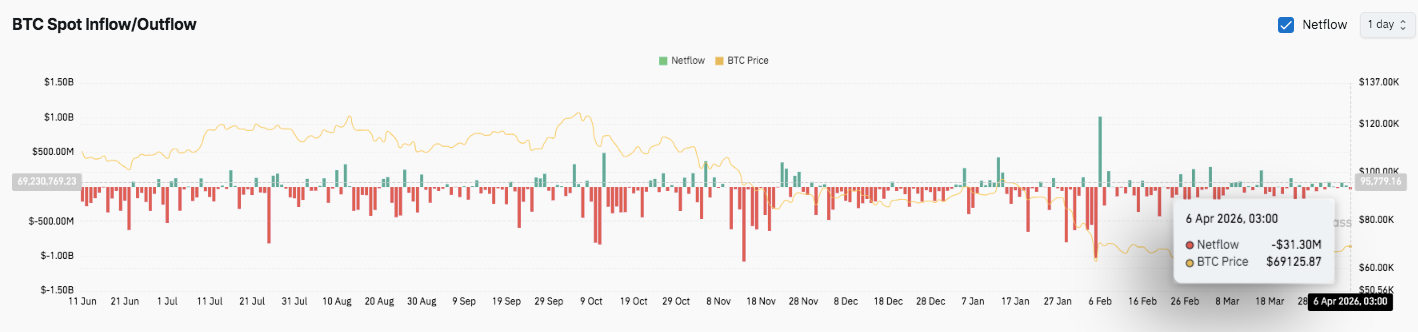
Spot flows also reflect potential caution, as outflows have dominated most of the recent period. This trend indicates continued selling pressure and limited accumulation.
Related: Cardano Price Prediction: ADA Breaks Above $0.25 Signaling 2025 Bull Market Return
Additionally, occasional inflows of funds fail to maintain momentum, leaving the market in a precarious balance. Therefore, Bitcoin remains at a critical juncture where either renewed buying or continued selling will determine its next move.
Technical outlook for Bitcoin price
As Bitcoin trades within a tightening range, key levels remain clearly defined.
Top level: The immediate hurdles are $69,300, $70,500, and $72,000. A breakout above these zones could extend towards $75,000 and $78,000, indicating new bullish momentum.
Lower price level: Trendline support at $67,000, followed by $66,300 and $65,200. The sub-$65,000 breakdown reveals deeper targets around $63,000 and $60,000.
Upper limit of resistance: $69,300 (0.618 Fib) will be the key level to reverse the medium-term bullish momentum. Additionally, $70,500 represents a strong rejection zone where sellers may re-emerge. Therefore, regaining these levels confirms the strength of the buyers and opens up higher targets.
Technical conditions suggest that Bitcoin is compressed within a narrow range between $67,000 and $69,500. Furthermore, the compression of the EMA and tightening of the Bollinger Bands indicates that increased volatility is imminent. As a result, the price may break decisively in one direction in the near future.
Will Bitcoin go up?
The direction of Bitcoin price will depend on whether buyers defend $67,000 and move above $69,300 on strong volume. Additionally, increased open interest during the rally supports continued bullishness, while sustained spot outflows weaken confidence in the upside.
If the bullish momentum strengthens with stronger inflows, Bitcoin could retest $70,500 and extend towards $72,000. Additionally, if a breakout above $72,000 is confirmed, a move towards $75,000 and $78,000 could be possible.
However, if the $67,000 cannot be retained, there is a risk that the structure will change. Once the breakdown is determined, there is a possibility that there will be a move towards $66,300 or $65,200. Furthermore, losing $65,000 could expose the liquidity zone below $63,000.
Related: Dogecoin price prediction: Polymarket traders bet on a 62% chance of DOGE reaching $0.10 in April
For now, Bitcoin is still in the decisive zone. Therefore, the next breakout will define the short-term trend. Conviction from buyers and a confirmed breakout will determine the next big move.