
Bitcoin remains at a critical juncture as traders keep a close eye on whether the major cryptocurrencies can sustain a recovery above key technical levels. The digital asset is currently trading around $73,458, following a pullback from the $60,000 area, which has recently attracted strong buying interest. As a result, market participants are now assessing whether this move signals the beginning of a broader recovery or just a blip in a broader correction trend.
The broader market structure still reflects the aftermath of the sharp decline from the previous peak above $120,000. However, the rebound from $60,000 shows that buyers remain active in this historically important demand zone. Therefore, the $70,000 area is currently serving as a major axis that could determine Bitcoin’s next direction.
Key support zones strengthen market floor
Technical indicators highlight several support zones that could stabilize the price in case of increased volatility. Instant support is between $72,000 and $70,000. This range is consistent with a cluster of short-term moving averages and a previous consolidation area. Therefore, holding this zone could strengthen the bullish momentum in the short term.
However, a failure to hold $70,000 will reveal deeper support levels. The $65,000 to $60,000 range remains the most important structural support. This level had previously attracted institutional demand during the market downturn in February. Additionally, many analysts believe that $60,000 is the definitive macro support level for the current market cycle.
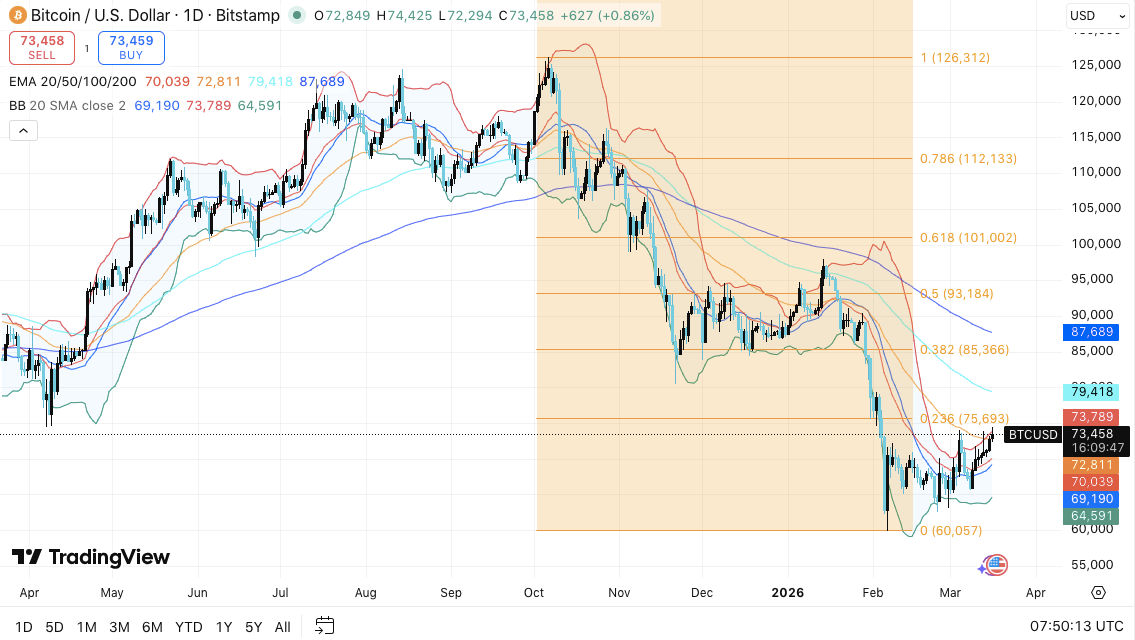
Bitcoin price dynamics (Source: Trading View)
A further decline towards $58,000 or $55,000 would indicate a stronger correction. These levels coincide with long-term moving averages and historical accumulation zones. As a result, traders treat this region as the last line of defense against the current trend.
Resistance levels shape Bitcoin recovery path
On the positive side, Bitcoin faces several hurdles before a complete trend reversal occurs. The first resistance appears between $75,000 and $76,000. This area coincides with the 0.236 Fibonacci retracement level.
Additionally, this level has historically created strong selling pressure. A break above this range could confirm the continuation of the near-term bullish momentum.
Related: Solana Price Prediction: $18M Short Extinguishes, SOL Returns to $94 Supertrend
Above that, $85,000 becomes a major resistance zone. This level corresponds to the 0.382 Fibonacci retracement and is located near the 100-day moving average. Therefore, above $85,000, market sentiment could change to a neutral or bullish outlook.
Importantly, the $93,000 to $101,000 range forms a broader trend reversal zone. These levels coincide with the 0.5 and 0.618 Fibonacci retracement markers. If Bitcoin reaches this area, the entire market structure will likely shift to a new bullish phase.
Derivative trading suggests market positioning
Derivatives data also reveals important clues about market trends. Bitcoin open interest expands during a rising phase and repeatedly contracts during a correction phase. Increased open interest during strong price movements indicates increased leverage participation among traders.
However, recent data suggests that a late cycle surge is followed by a cooling phase. Currently, open interest is stable at a moderately high level. This pattern often reflects cautious position changes before the next big price move.
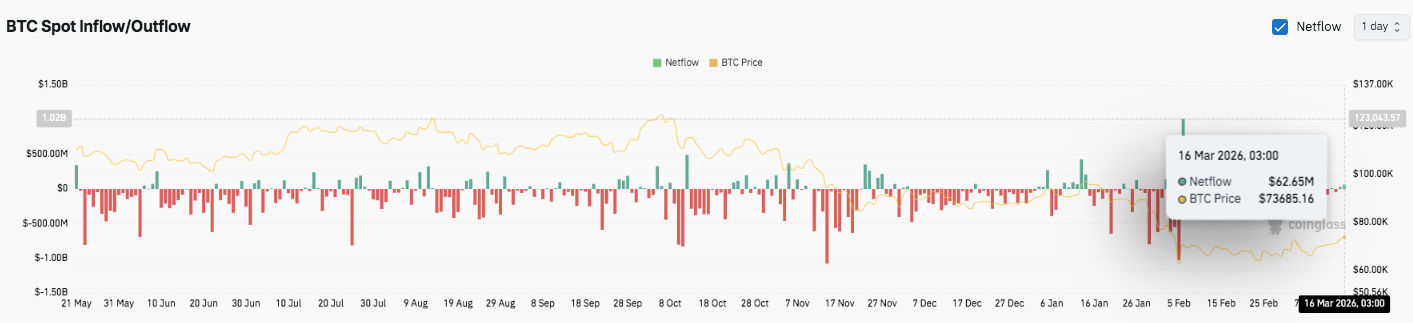
Source: Coinglass
Exchange flow data supports this interpretation. Continued runoff from late May to March suggests continued accumulation. Investors continue to move coins out of exchanges, which typically indicates long-term holding behavior.
Related: Ethereum Price Prediction: Could ETH Surpass $2,500?
Furthermore, February recorded one of the largest outflow clusters during a price crash. This pattern suggests that investors viewed the decline as a buying opportunity. Small inflows have recently returned in March. Nevertheless, broader trends still favor accumulation over distribution.
Technical outlook for Bitcoin price
Key Bitcoin levels remain well defined as the market attempts to recover from the recent correction.
Top level: $75,000 stands as an immediate breakout barrier. A move above this level could lead to a push. $BTC The collection goal is $85,000, followed by $93,000 and $101,000.
Lower price level: $70,000 remains the key pivot support. A breakdown could trigger a decline towards $65,000, with key structural support likely near $60,000.
Upper limit of resistance: The $85,000 zone coincides with the 0.382 Fibonacci retracement and the 100-day moving average and represents a key level that bulls must regain to change medium-term momentum.
The broader technical structure suggests that Bitcoin is holding firm after a strong correction from its $120,000 peak. Price is currently trading within a recovery channel and is trying to build momentum above the short-term moving average. Therefore, the $70,000-$75,000 range serves as the market’s decision zone.
Will Bitcoin go up?
Bitcoin’s next move will largely depend on whether buyers can defend the $70,000 support while building enough momentum to break through the $75,000 resistance. If buying pressure continues above this level, it may attract new participation from institutional investors. the result, $BTC Earnings could grow towards $85,000 and eventually challenge the $93,000 area.
Additionally, derivatives market data suggests that traders are starting to cautiously rebuild positions after the last liquidation cycle. The exchange flow trend also shows that long-term accumulation continues as coins move out of trading platforms. These signals often support gradual price stabilization before a big move.
However, the bullish scenario depends on whether the current support structure can be maintained. If Bitcoin loses its $70,000 pivot, selling pressure could accelerate rapidly. In that case, $BTC We may revisit the $65,000 area and retest the $60,000 macro support level.
For now, Bitcoin is still at a pivotal stage. The market is showing early signs of recovery, but it will take a definitive breakout above $75,000 to confirm it. Until that happens, $BTC The price is likely to continue consolidating within the defined range as traders wait for the next directional cue.
Related: Cardano Price Prediction: ADA Soars 7% After $0.277 Fibonacci Break on Hormuz Easing
Disclaimer: The information contained in this article is for informational and educational purposes only. This article does not constitute financial advice or advice of any kind. Coin Edition is not responsible for any losses incurred as a result of the use of the content, products, or services mentioned. We encourage our readers to do their due diligence before taking any action related to our company.