The US-China trade deal and the US Federal Reserve’s recent interest rate cuts have eased macroeconomic pressures and created favorable conditions for risk assets. However, Bitcoin’s next move will depend on whether we see a breakout above the 100-day moving average or whether the 200-day moving average holds as structural support.
Until one side of this equilibrium is disrupted, the market will likely remain in accumulation and consolidation mode, compressing volatility ahead of the next big impulsive move.
technical analysis
Written by Shayan
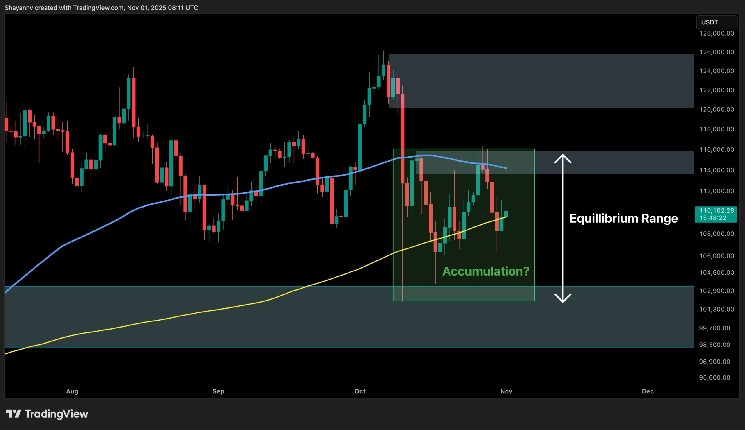
daily chart
On the daily time frame, Bitcoin is fluctuating between the 100-day moving average near $114,000 and the 200-day moving average near $109,000, forming a well-defined equilibrium zone. The repeated rebound from the 200-day moving average indicates that the $114,000 to $116,000 range is acting as a strong distribution zone, while the $108,000 to $109,000 range continues to attract institutional demand.
This structure highlights the current state of the market’s balance between buyers and sellers. The ongoing stabilization phase could represent an accumulation pattern, as indicated by clustered price action between two major moving averages.
A confirmed daily close above the 100-day moving average would likely trigger a breakout toward $120,000 to $122,000, while a breakout below $108,000 could re-expose the $102,000 to $104,000 institutional demand zone.
Improving macro sentiment due to the FOMC’s dovish policy axis and US-China cooperation framework could support continued bullishness if on-chain and volume indicators confirm accumulation.
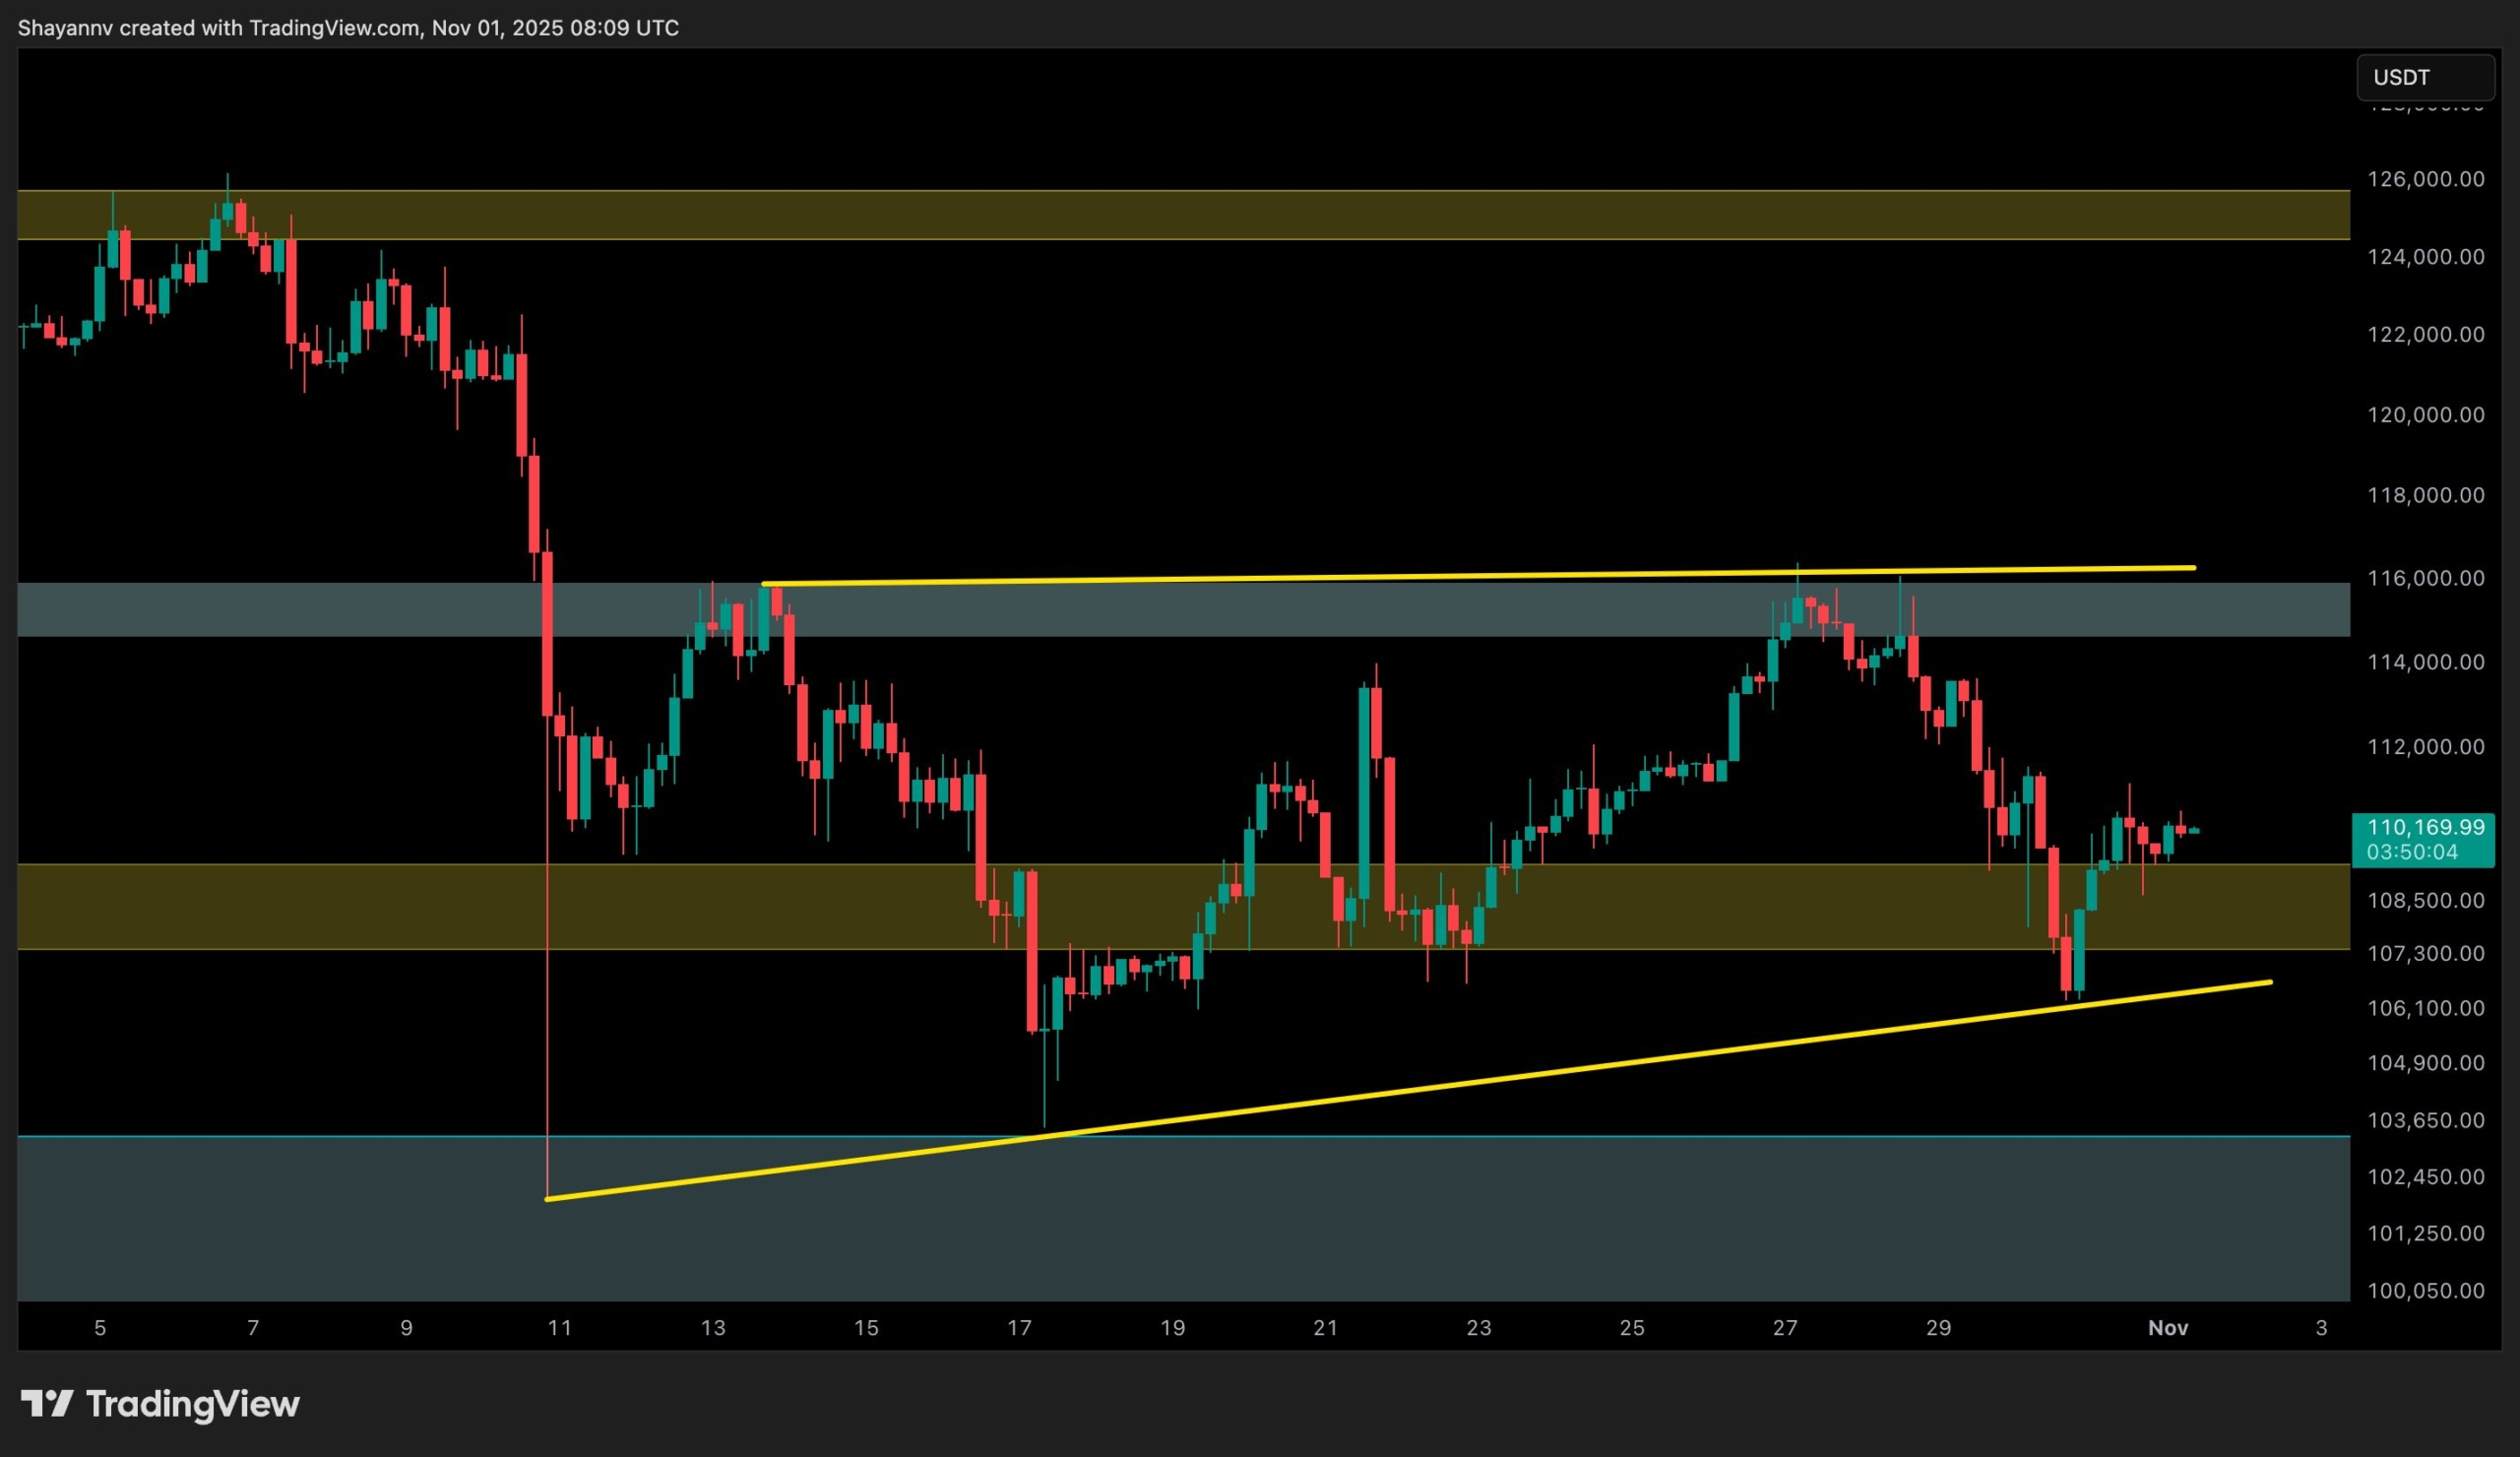
4 hour chart
The 4-hour time frame reinforces the range-bound nature of Bitcoin’s recent movements. The price has repeatedly reacted from the $108,000-$109,000 support zone, forming higher lows and attempting to regain short-term structure. However, the $115,000-$116,000 resistance band remains a ceiling that has limited multiple upside attempts in the past.
This setup outlines a symmetrical consolidation within an ascending structure, suggesting volatility is tapering ahead of a potential breakout.
A bullish breakout above $116,000 could signal a structural change towards $120,000-$122,000, but failure to sustain the $108,000 area would confirm a deeper retest towards the $102,000 liquidity pocket.
Until we break out either side of the range, we expect the market to fluctuate between these levels, with continued low volatility ahead of the next expansion.
On-chain analysis
Written by Shayan
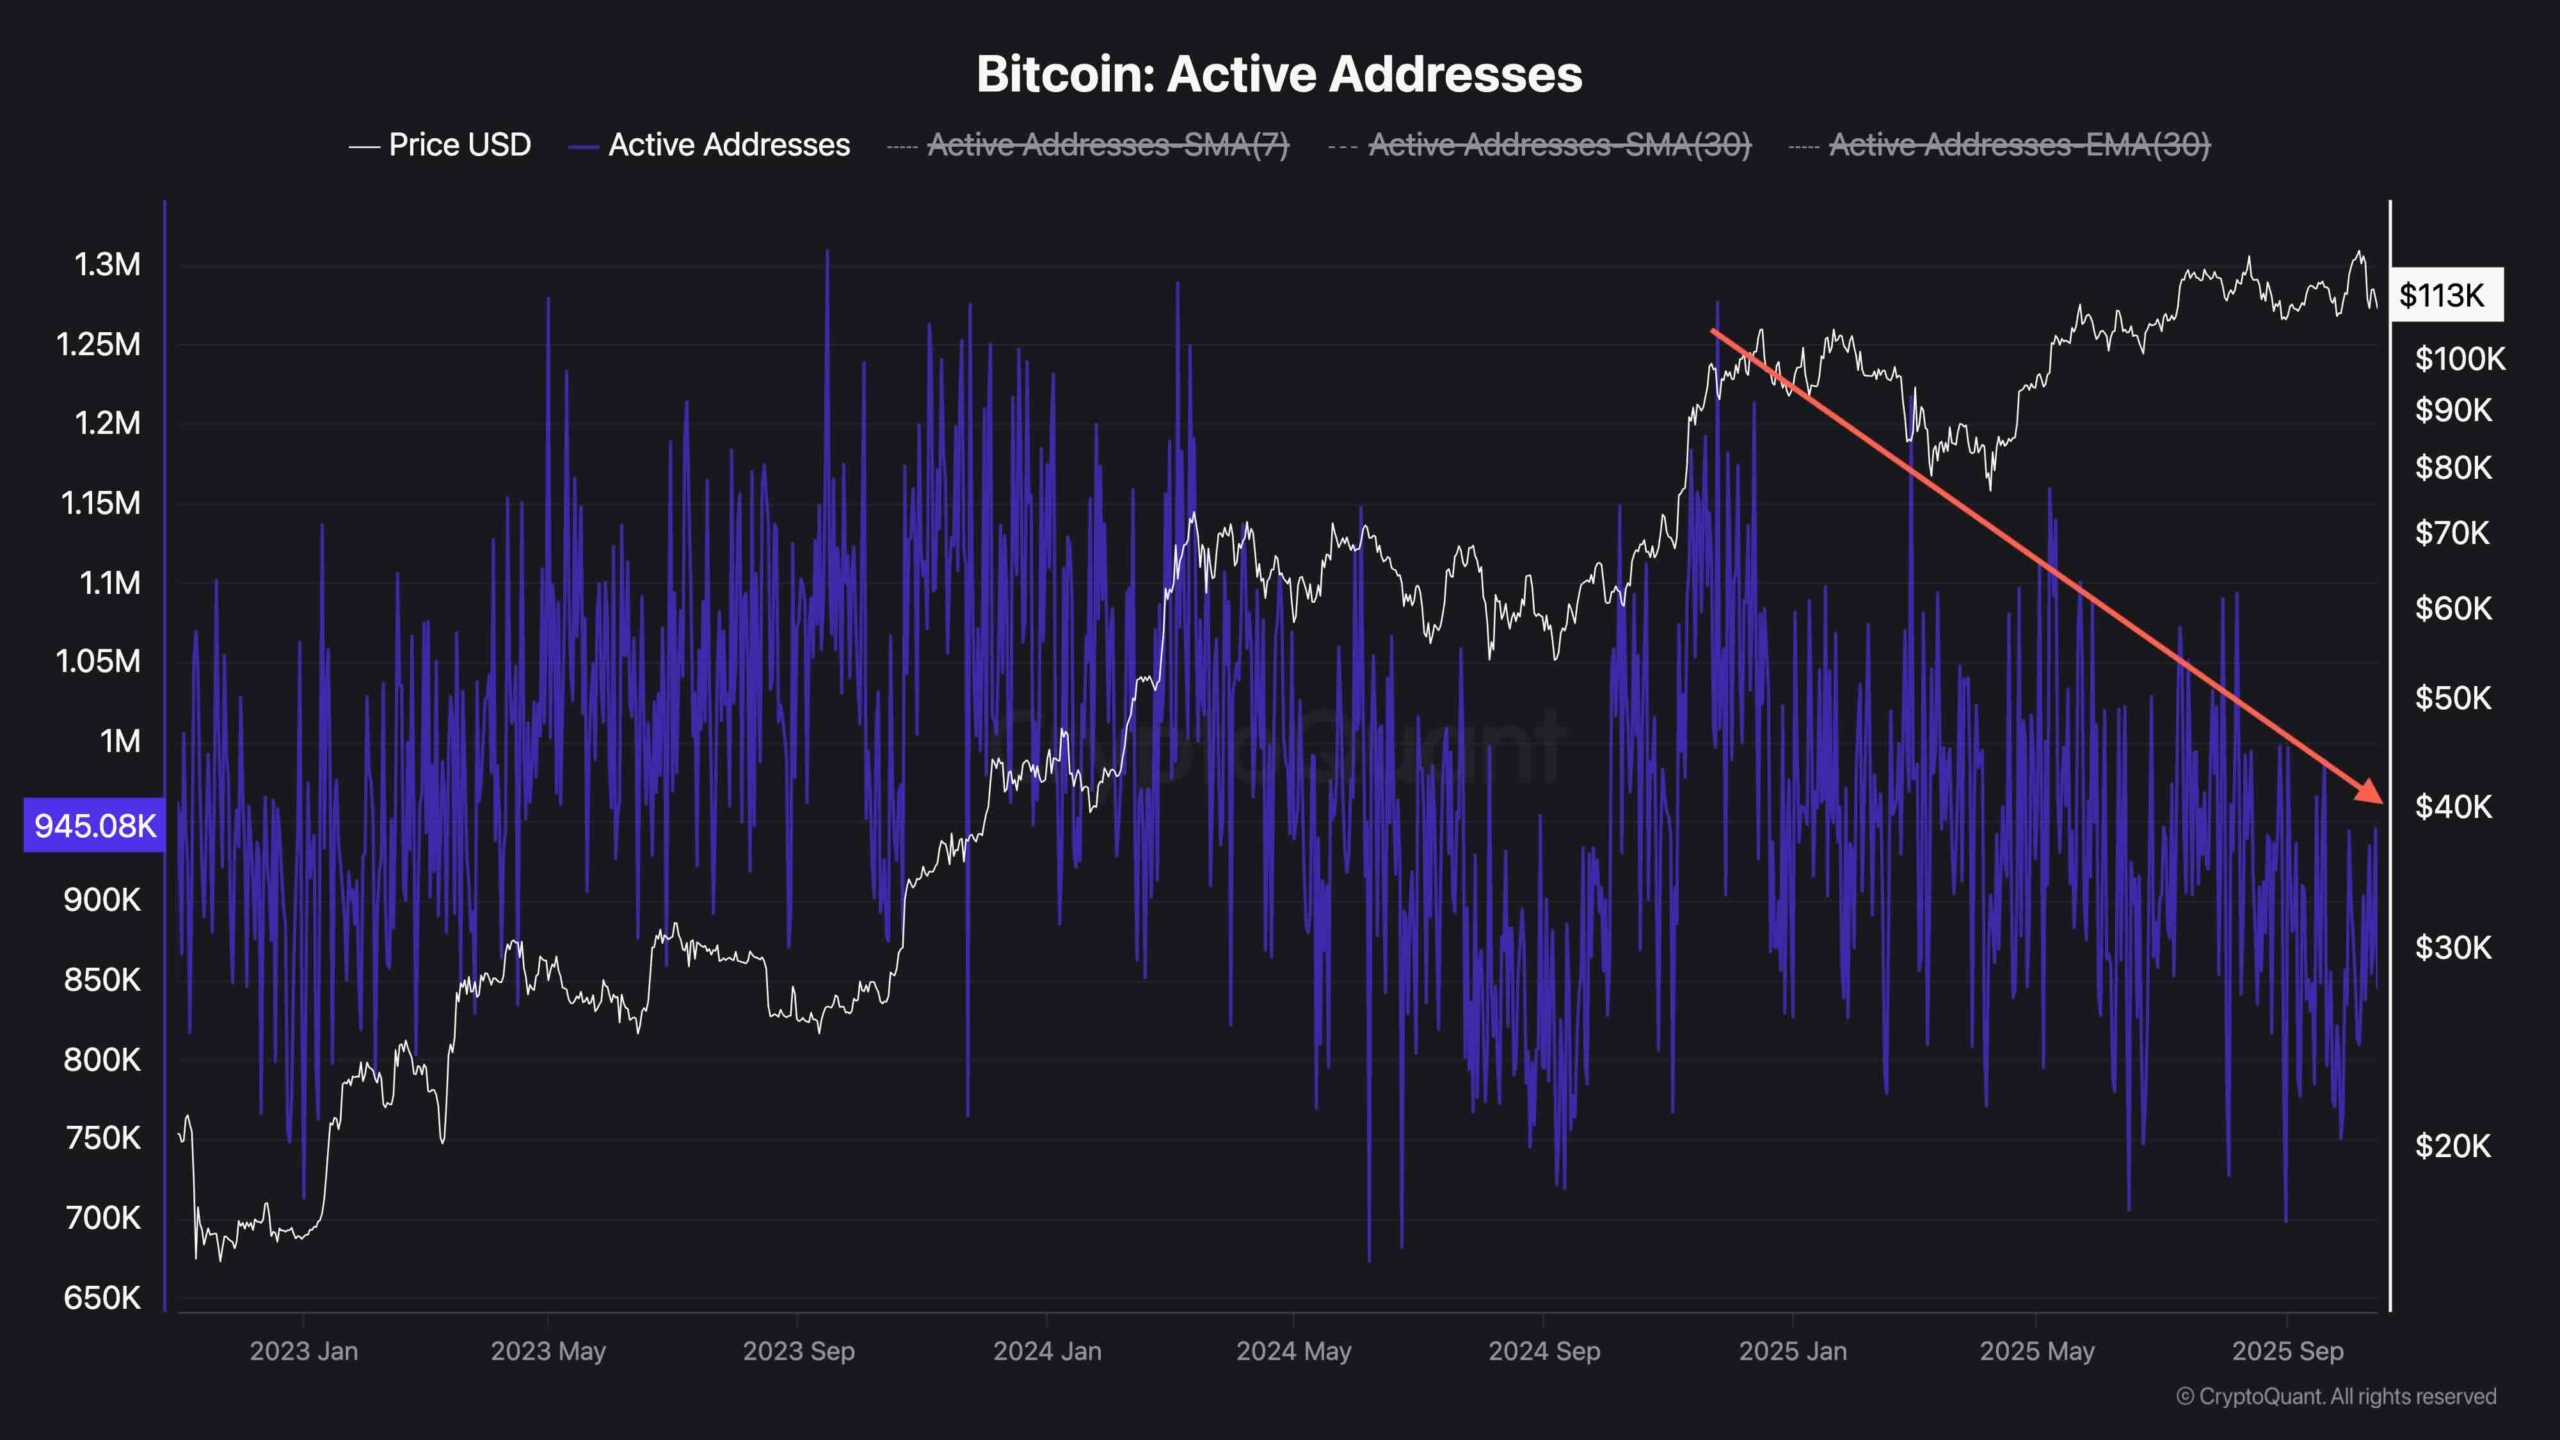
Bitcoin active addresses provide important signals about market participation and network health. In recent months, the number of active addresses has gradually declined, even as Bitcoin prices have remained near all-time highs. Historically, such declines in on-chain activity often reflect market fatigue or short-term distributions, especially after long rallies.
However, current activity levels, while subdued, are still above the 2024 cumulative baseline, suggesting the market has not experienced complete capitulation.
Periods of reduced address activity around major support levels often precede large accumulations or trend reversals, as seen in late 2023 and mid-2024.
If active address growth stabilizes while prices maintain the $108,000-$110,000 support range, consistent with the macro environment of increased global liquidity, investor sentiment will improve after the Fed rate cut, and the case for an accumulation-driven bottom will become stronger.