Bitcoin price regains $70,000 due to change in macro sentiment
Bitcoin ($BTC) successfully broke through. $70,000 This Saturday, the February 14, 2026 resistance level marked an important psychological victory for the bulls. After a rocky start to the month where prices tumbled towards $60,000, major cryptocurrencies have seen a V-shaped recovery, driven by cooling inflation statistics and a massive “short squeeze” in derivatives markets.
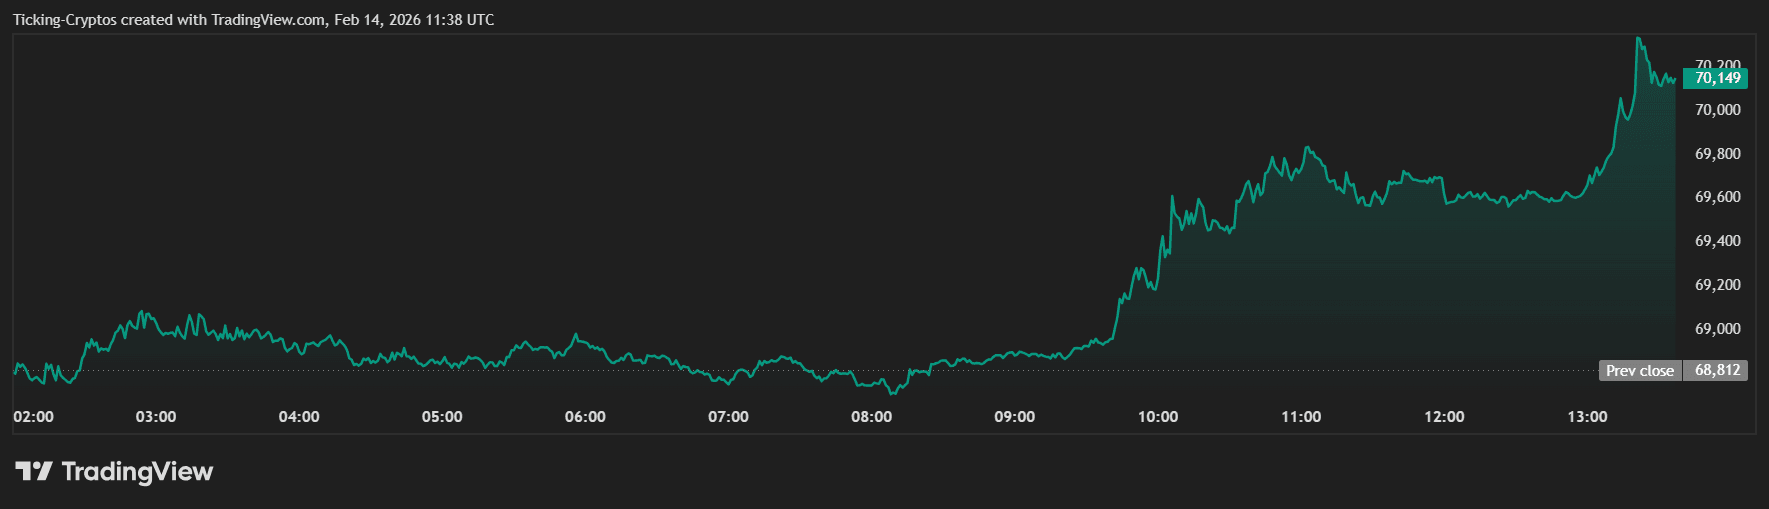
Bitcoin price rises in USD – TradingView
This move signals a change in the short-term narrative. While previous weeks have been dominated by “extreme fear” (the index hit a low of 5), the $70,000 recovery suggests buyers are pulling back to take advantage of a more favorable macroeconomic backdrop. Investors are now focused on whether Bitcoin can turn this former resistance into a solid support floor.
Why is the price of Bitcoin rising today?
The main drivers of today’s rally are the latest US Consumer Price Index (CPI) The report was released on February 13th. The data showed that inflation is slowing. 2.4%This was lower than the market expectation of 2.5%.
- Expectations for the Fed pivot: Lower inflation increases the likelihood that the Federal Reserve will cut interest rates sooner than expected. Historically, Bitcoin has thrived in highly liquid environments with low borrowing costs.
- Deleveraging reset: The crash in early February wiped out billions of dollars in overleveraged long positions. The current movement is further driven by spot demand and organic trading volume, with a “cleaner” order book and total open interest holding steady at around $31 billion.
- Correlation: $BTC currently has a strong positive correlation (+0.6) with US tech stocks (NASDAQ 100). As stocks recover from their inflationary “failure”, Bitcoin is following suit as the ultimate high-beta risk asset.
Bitcoin price analysis: $BTC/Is the USD breakout confirmed?
If you look at the 1 hour chart provided, TradingViewthe technical structure has become decisively bullish. After weeks of being trapped below the red descending resistance line, $BTC I finally broke through.
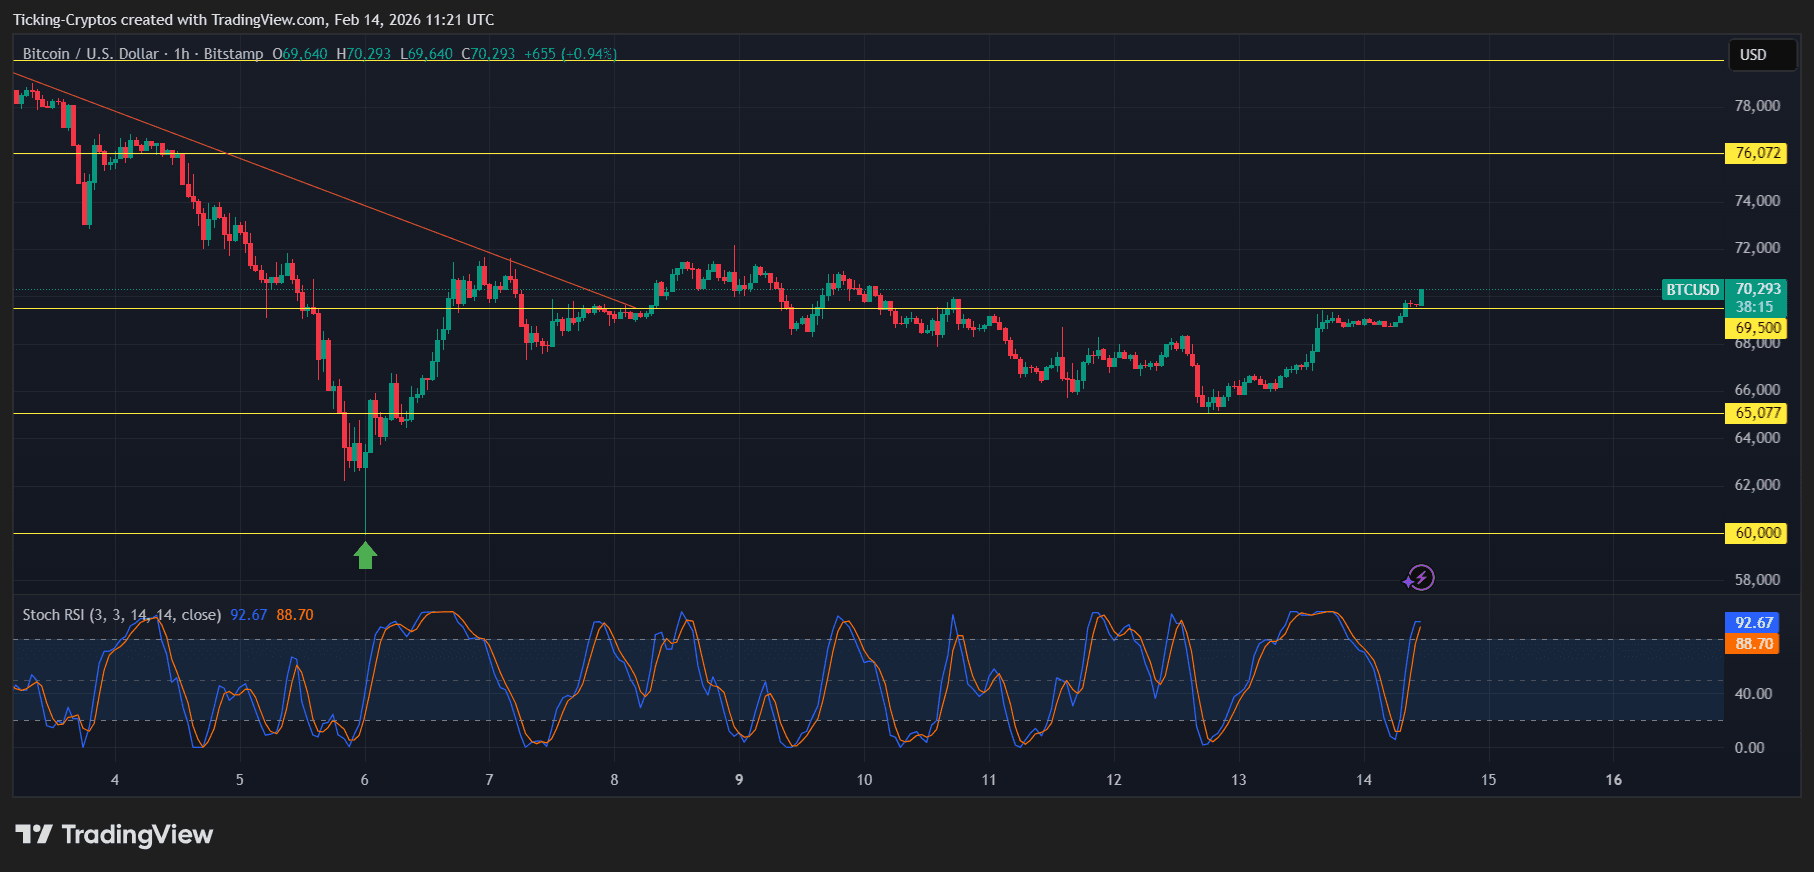
$BTC/USD 1H – TradingView
Main observations of the chart:
- Breakout: Bitcoin is traded on $70,293cleared the immediate hurdle of $69,800.
- Momentum indicator: of Stochastic RSI Currently in overbought zone 92.67. While this confirms intense buying pressure, traders should be wary of a potential “retest” to confirm the $69,500 level as support.
- “Golden Pocket”: if $BTC Hold position above $70,000, next target is liquidity cluster around it $74,750followed by great resistance $76,072.
“It will be important to close the daily candlestick above $71,000. Success would invalidate the bearish ‘dead cat bounce’ narrative and set the stage for a rally towards $80,000.” — Technical analyst perspective
Bitcoin Future Target: Possible $BTC Will it reach $100,000 in 2026?
Despite the current rally, major institutions remain divided on the long-term outlook for this year.
- Standard Chartered: I recently set my year-end goal at $150,000. $100,000warned that although the long-term trend is up, the situation will remain unstable due to the possibility of ETF outflows.
- JP Morgan: Retains a more optimistic stance, views Bitcoin as “digital gold”, fair value target close $170,000 Based on a volatility adjusted model compared to gold.