
Ethereum is showing tentative signs of easing after weeks of downward pressure, but the recovery remains fragile. Currently, the price is struggling to decisively break above the $3,400 level, which has repeatedly acted as resistance during recent rebound attempts. Although near-term sentiment is improving as the overall market stabilizes, risks remain high. Several analysts have warned that Ethereum could face further declines in the coming weeks if momentum weakens and macro and liquidity conditions worsen again.
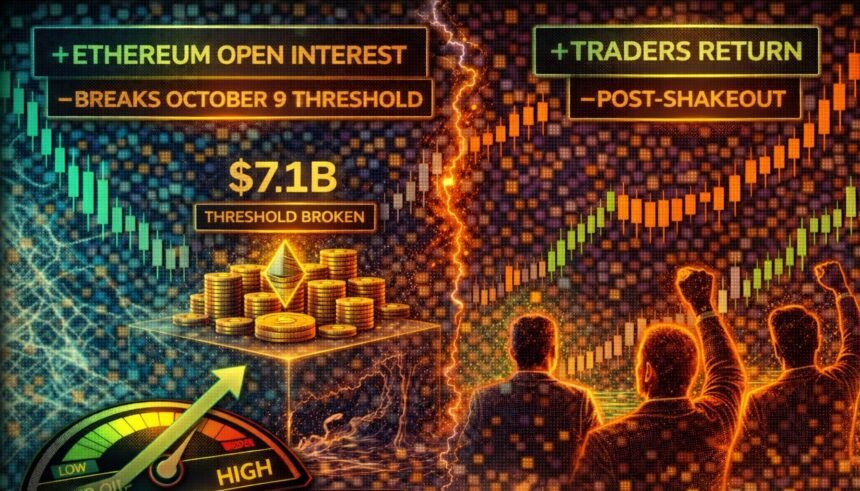
Derivatives data further complicates the situation and suggests new accumulations of risks. Arab Chain’s report highlights that Ethereum’s open interest on Binance has risen to approximately $8.6 billion, reaching its highest level since October 9th.

This marks a notable shift after a long period of contraction following October’s sharp liquidation event, when open interest collapsed from over $10 billion to less than $7 billion in a matter of days. This event removed excess leverage from the market and forced traders into a defensive posture.
The current increase in open interest indicates that traders are gradually returning and rebuilding positions at lower price levels. However, this price sensitivity to a sudden movement.
Ethereum is currently testing a major structural resistance zone around $3,400, and the latest derivatives data adds important context to this price move. According to a report on CryptoQuant by Arab Chain, the increase in open interest on Binance reflects new activity in the derivatives market and a clear resurgence in traders’ appetite for leverage. This is a marked change from the defensive posture seen after October’s wave of liquidations.
What stands out is that the increase in open interest is occurring while ETH is trading around $3,300-$3,400, well below previous cycle highs. This suggests that traders are not chasing price extremes, but are building positions at relatively discounted levels. Historically, this type of positioning often reflects expectations for medium-term upside rather than short-term speculation.
At the same time, the fact that open interest has reached its highest level since October 9 without reverting to previous overheated extreme levels indicates a more balanced recovery. If this growth is driven by steady inflows rather than aggressive leverage, it would support the idea that a healthier market structure forms after the post-liquidation contraction phase.
However, the risk remains asymmetric around the resistance. A sustained and rapid increase in open interest while the price stalls below $3,400 could increase vulnerability to sharp volatility. For Ethereum to maintain momentum, price and open interest need to remain in line, confirming that confidence is rebuilding rather than being overstretched.
Ethereum price action on the daily chart shows that the market is trying to recover but is still constrained by significant structural resistance around $3,400. After plunging from its October highs, ETH established a local bottom below $2,900 and has made even higher lows since then, suggesting short-term stabilization rather than a confirmed trend reversal.

The price is currently trading around $3,300, with multiple technical factors converging. The falling 200-day moving average and the previous horizontal support-turned-resistance are limiting any upside momentum. Each rally into this zone is in response to selling pressure, highlighting that this region remains an important supply area. The inability to recover $3,400 makes the broader structure decisive to remain bearish to neutral.
On the downside, initial support lies in the rising short-term moving averages and recent lows around $3,000-$3,050. As long as ETH stays above this range, the market will maintain a constructive consolidation structure rather than resuming its previous impulsive downtrend. Volume has remained moderate during the recovery period, indicating controlled participation rather than aggressive speculative buying.
ETH is compressed between rising short-term support and falling long-term resistance. This type of price action often precedes directional movements. A close of the day cleanly above $3,400 would signal a change in market control and open the door to a broader recovery.
Featured image from ChatGPT, chart from TradingView.com
editing process for is focused on providing thoroughly researched, accurate, and unbiased content. We adhere to strict sourcing standards, and each page is carefully reviewed by our team of top technology experts and experienced editors. This process ensures the integrity, relevance, and value of your content to your readers.