
Ethereum price is trading around $3,210 today, remaining slightly above its weekly low after breaking below the long-term trend line that guided its 2025 structure. This trendline loss will shift momentum to sellers, especially as spot outflows increase and the EMA cluster turns into resistance.
Spot outflows increase as sentiment weakens
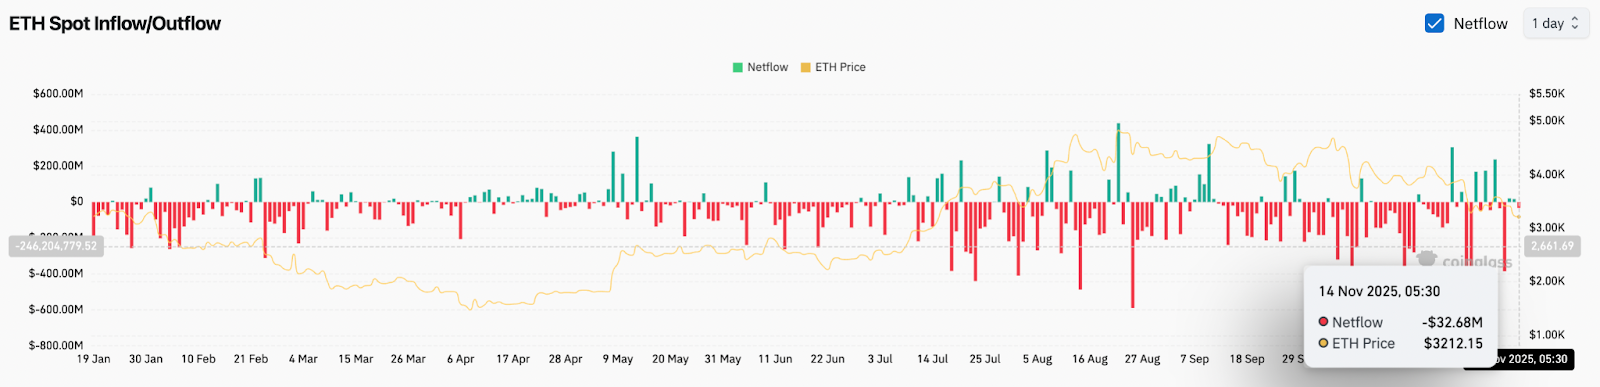
ETH Netflows (Source: Coinglass)
ETH spot flow remains negative. Coinglass showed net outflows of $32.6 million on November 14, extending a multi-week pattern of consistent distributions. Red print continues to dominate the flowchart, reflecting sustained sales rather than accumulation.
If spot outflows remain negative while price breaks through a major trend line, the market typically enters a defensive phase. Liquidity leaves the ecosystem and buyers lose confidence in short-term upside. The recent decline confirms a cautious shift in sentiment.
Trendline loss makes the structure bearish
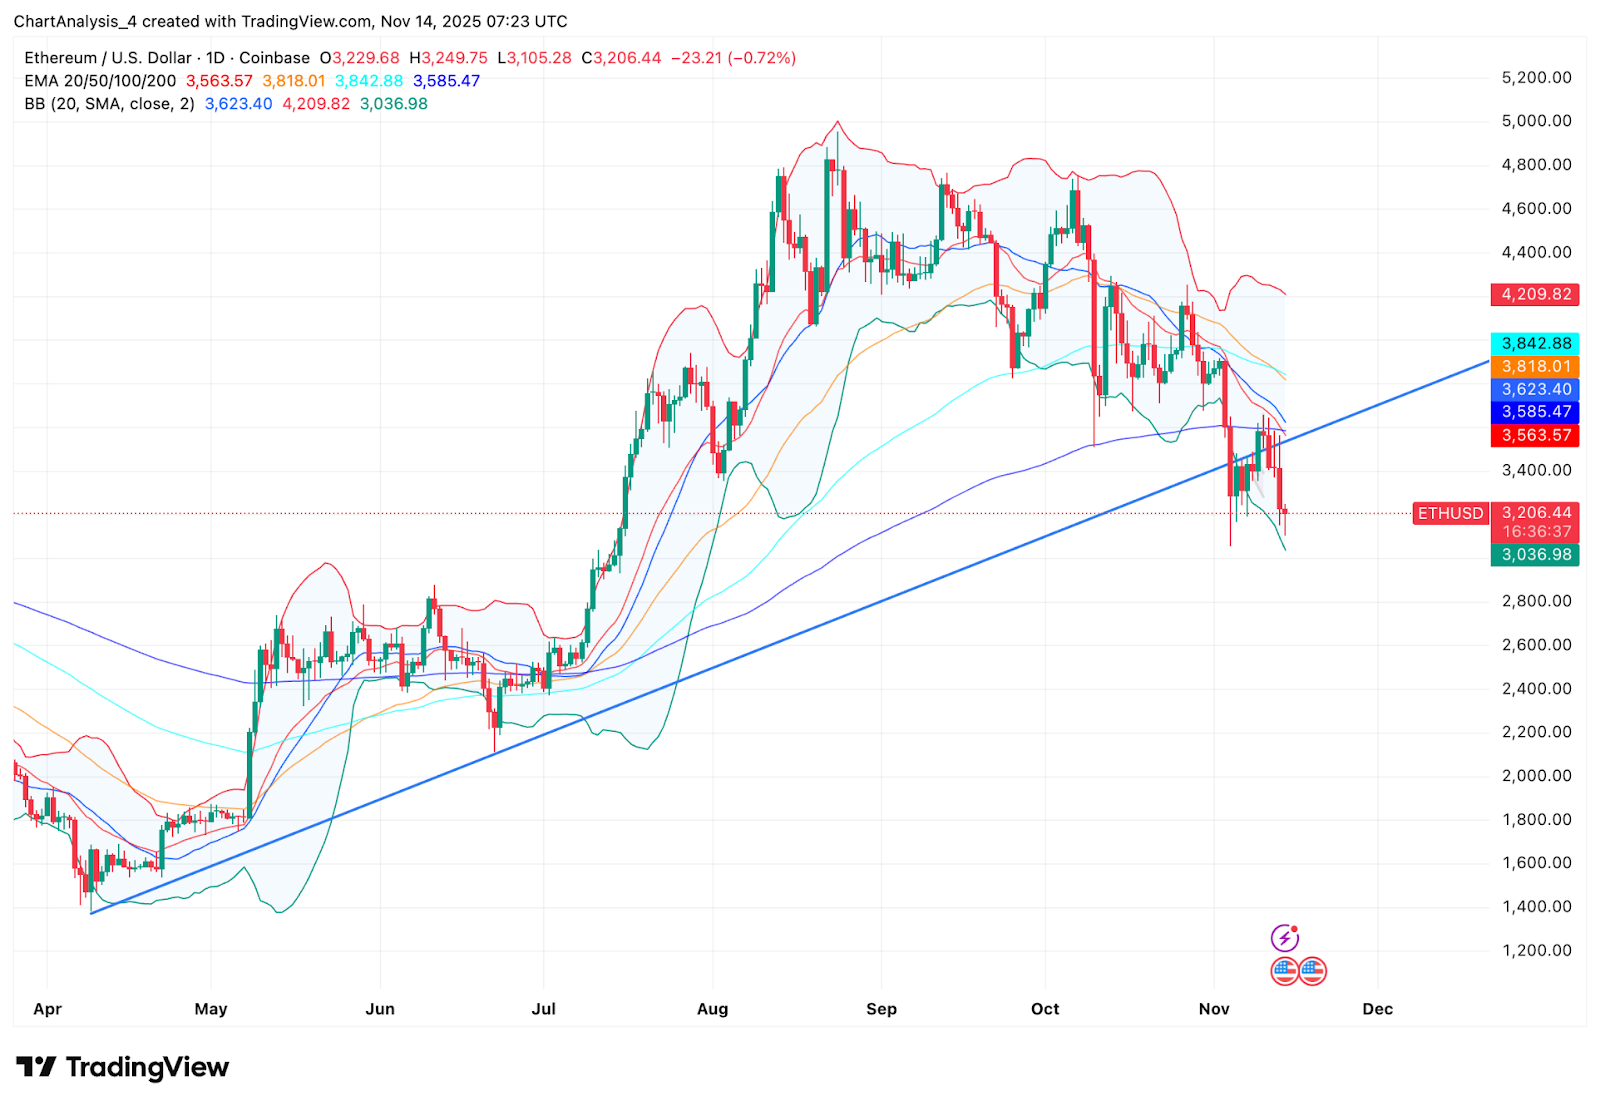
ETH price fluctuation (Source: TradingView)
The daily chart shows that Ethereum is decisively below the uptrend line extending from April. This is the first complete violation of this structure in over seven months. A trendline break of this length indicates a deeper change in market behavior rather than just a normal pullback.
ETH is currently trading below the 20-day, 50-day, 100-day, and 200-day EMAs located between $3,563 and $3,842. The entire region has turned into overhead resistance, forming a thick ceiling above the current price.
Bollinger Bands show that ETH has been riding on the lower band for several sessions, indicating sustained downside pressure. Sellers were able to keep the price below the mid-band at $3,623, which is currently a key level for recovery.
Immediate support lies around $3,050 to $3,030, where the lower band and pre-October demand zone converge. If this shelf fails, the next major demand zone is around $2,880.
Intraday structure shows attempts at stabilization
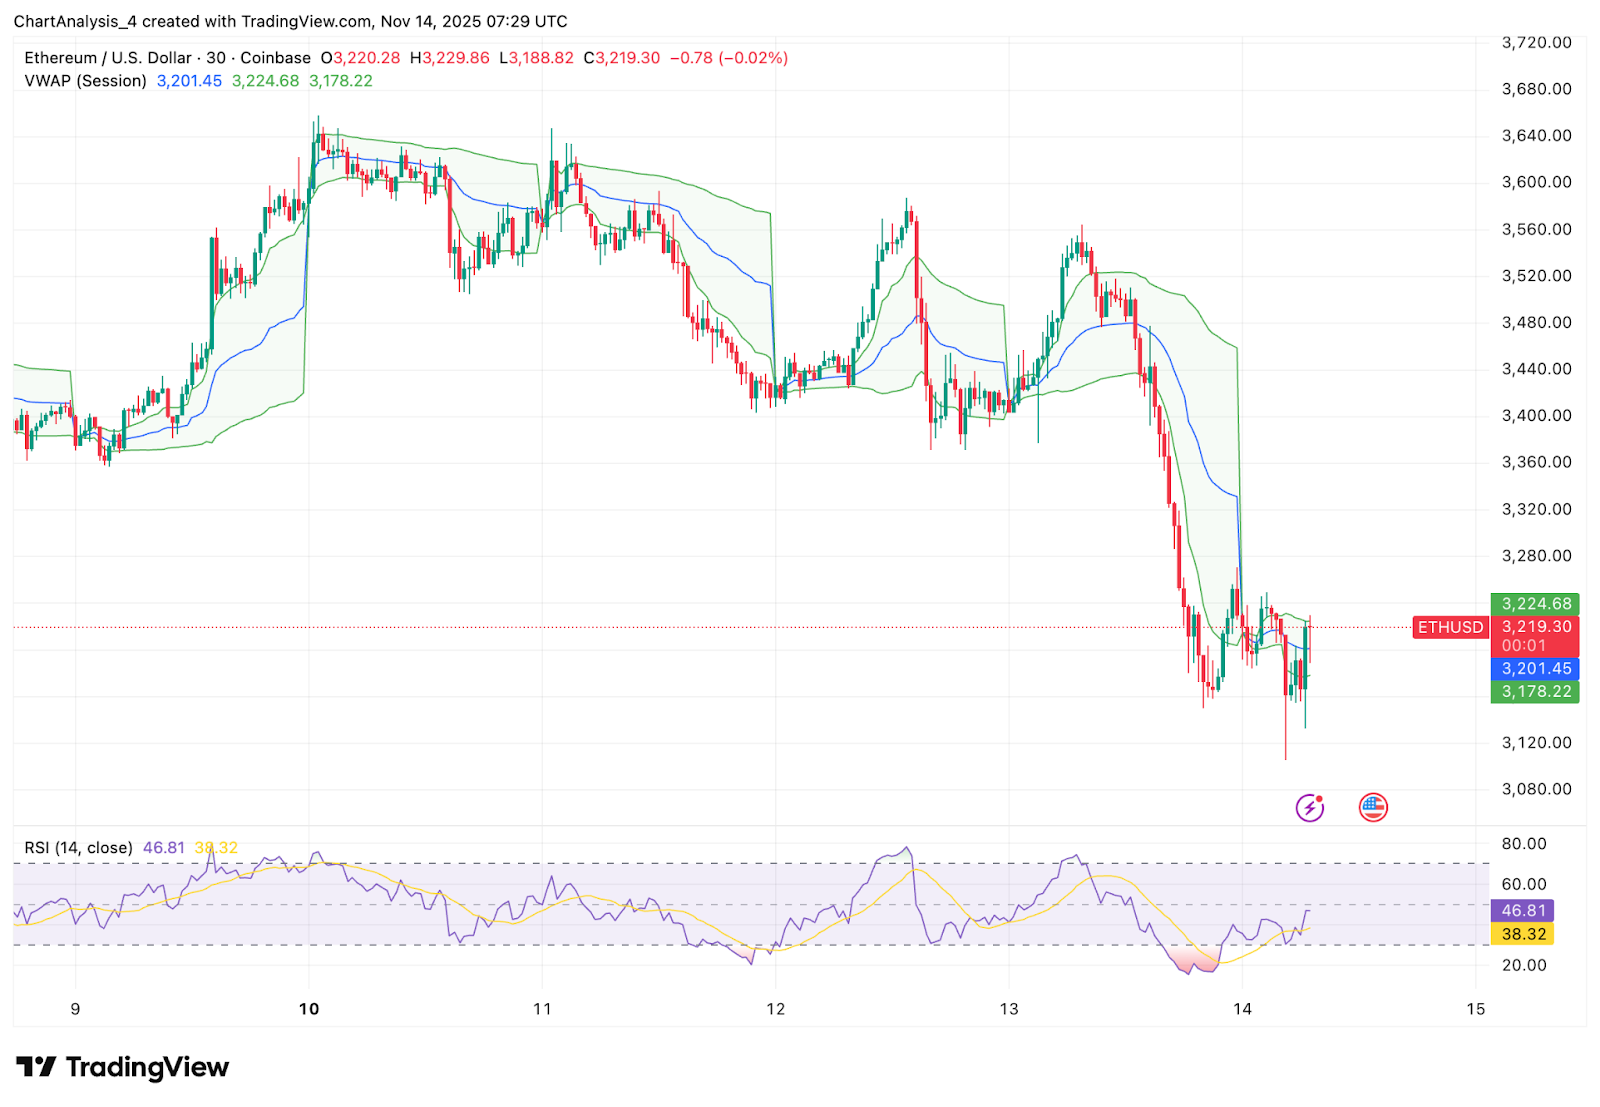
ETH price dynamics (Source: TradingView)
On the 30-minute chart, Ethereum is looking for short-term stability above $3,180. Price is testing the VWAP band, a zone that intraday traders often use as a balance area during correction stages.
The RSI has recovered from oversold levels and is now sitting around 46, indicating an early attempt to restore short-term momentum. However, all rebounds so far have been capped by the VWAP midline located around $3,201 to $3,225.
The key intraday level is $3,260. A break above this level would be the first change in the upside structure since the sharp drop two sessions ago. Without reclaiming this area, ETH remains vulnerable to a fresh selloff towards $3,100.
outlook. Will Ethereum go up?
Ethereum is at a critical juncture after losing its long-term trend line and falling below the EMA cluster. The next move will depend on whether buyers can reestablish support between $3,180 and $3,050.
- Bullish case: ETH needs to recover $3,260 and then push towards $3,563. A close above the 20-day EMA would be the first real sign that downside pressure is easing. Momentum will only change if the price breaks above the EMA cluster and opens the door to $3,840.
- Bearish case: If the daily close is below $3,050, the next demand zone is $2,880. If flows remain negative and spot distributions continue, the correction could deepen further towards $2,750.
Disclaimer: The information contained in this article is for informational and educational purposes only. This article does not constitute financial advice or advice of any kind. Coin Edition is not responsible for any losses incurred as a result of the use of the content, products, or services mentioned. We encourage our readers to do their due diligence before taking any action related to our company.