
Ethereum price was unable to recover until today above $3,000 as investor demand for staking the token continues to weaken. Will Ethereum bulls manage to regain momentum and break through this important level?
summary
- The price of Ethereum has fallen 30% over the past month.
- The amount of staked ETH has decreased significantly over the past few months.
- A death cross pattern is looming on the daily chart.
According to data from crypto.news, Ethereum (ETH) rose to an intraday high of $2,973 on November 26th, but failed to break through the key psychological resistance of $3,000, settling at $2,938 at the time of writing. At this level, the second-largest crypto asset by market capitalization (valued at $354.5 billion) remains down nearly 30% over the past month and trades 40.6% below its all-time high set in August of this year.
Ethereum price has repeatedly faced resistance at $3,000, but failed to break out of that area again earlier today as staking inflows continue to trend weakly.
For context, staking inflows are an indicator of when investors withdraw their ETH holdings from exchanges for staking. As a proof-of-stake cryptocurrency, staking helps strengthen the security of the Ethereum network and is generally seen as supporting asset prices, as staked ETH is locked and essentially taken out of circulation.
You may also like: Bitcoin ETF outflows exceeded $3.5 billion in November, but is BTC at risk of further losses?
Staking inflows have fallen from $160,000 near the end of October to just $2,941 now, as traders continue to rotate to other cryptocurrencies that offer better yields with lower investment thresholds, according to CryptoQuant data.
“Investors still believe that Ethereum at its current price (around $2,900) is too expensive to stake. This situation could push the price down towards $2,500,” CryptoQuant analysts noted in a recent market report.
At the time of writing, Ethereum’s annual staking yield was around 1.9-2%, much lower than some of its competing proof-of-stake cryptocurrencies, such as Avalanche’s 4.7%, Solana’s 4.2%, and Bittensor’s 14.7%.
In addition to the bearish outlook, the Ethereum ETF has also experienced significant net outflows since early November, totaling $1.56 billion so far. This suggests that institutional investors who previously supported ETH through ETF exposure are also turning their backs on ETH, at least for now.
On the daily chart, Ethereum price has formed multiple bearish patterns that could keep traders at bay and lead to an even sharper correction in the short term.
The 50-day simple moving average is nearing a crossover with the 200-day simple moving average, forming a death cross, a pattern that typically signals weakening market momentum ahead of an extended downtrend.
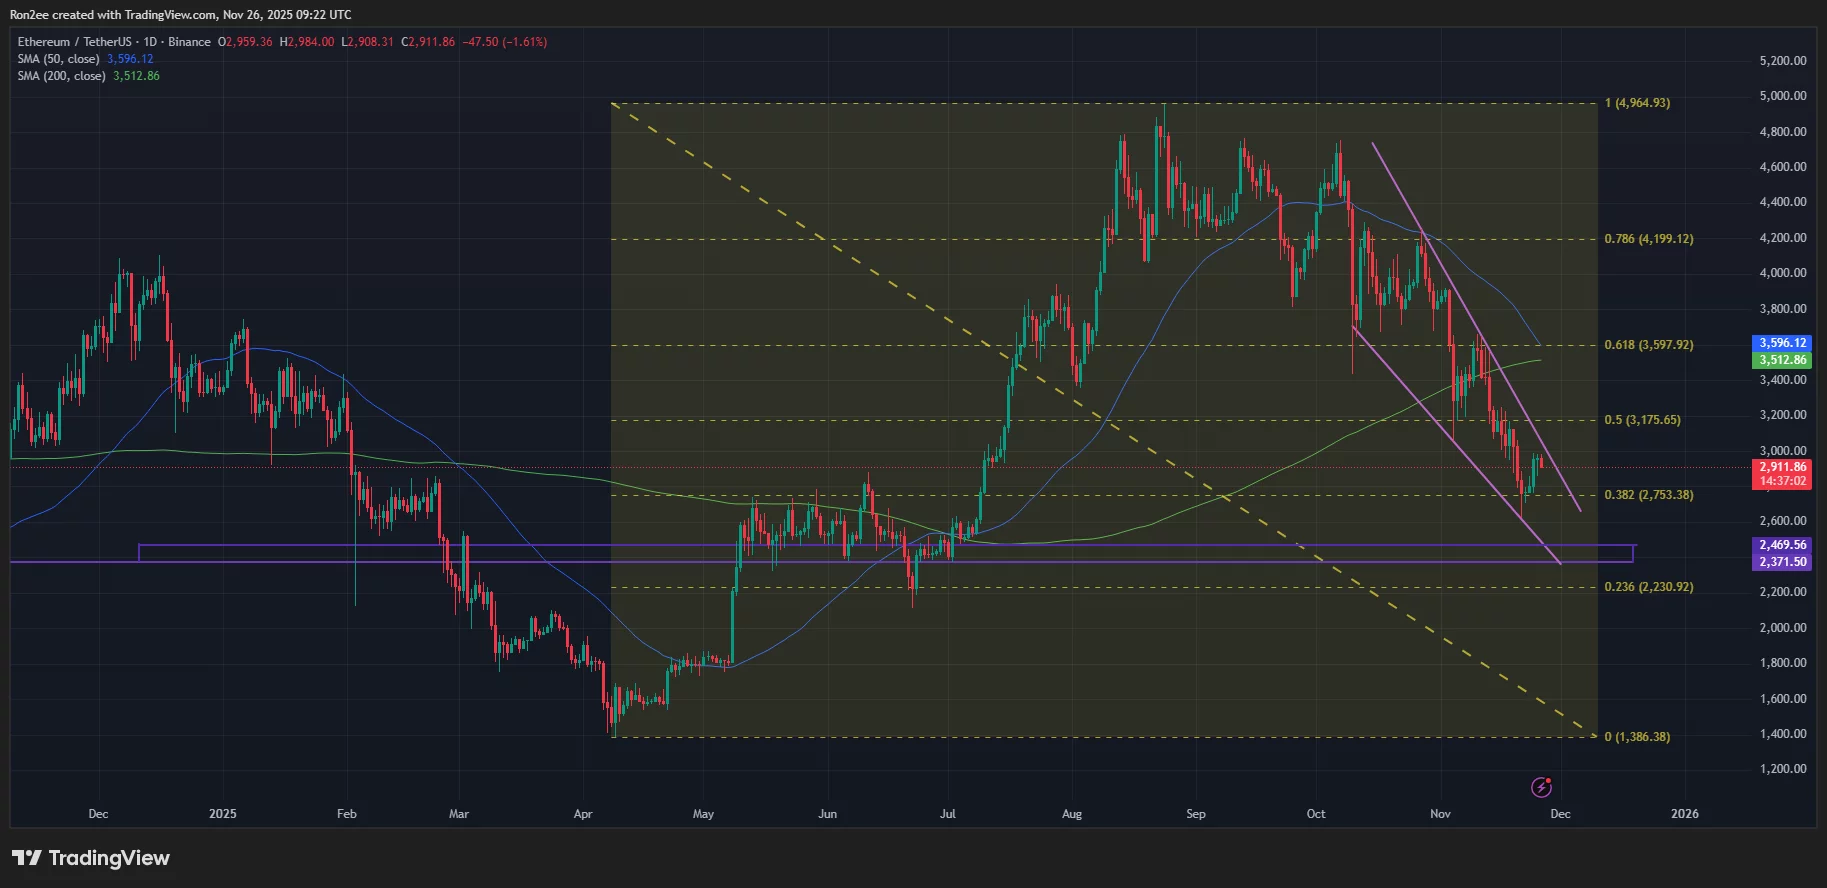
Ethereum price forms a death cross pattern on daily chart — November 26 | Source: crypto.news
According to a previous report on crypto.news, the price trend of altcoins also seems to be forming a rounded top pattern. This is also a bearish formation and often indicates the exhaustion of buying pressure, potentially paving the way for an extended decline.
For now, traders are most likely focused on the $2,370 to $2,470 zone. This zone has historically served as a strong support level earlier this year and is the range where the bulls have previously shown successful rebounds. A decisive fall below this area could open the door to further losses.
However, on a more positive note, there could be a potential recovery if Ethereum can break out of the descending wedge pattern that is also forming on the daily chart. When an asset breaks out of a descending wedge, especially when accompanied by strong volume and positive market sentiment, it is usually seen as a sign of an impending bullish reversal.
read more: With the Spot SOL ETF recording $53 million in inflows, will Solana price rise above $140?
Disclosure: This article does not represent investment advice. The content and materials published on this page are for educational purposes only.