
Ethereum is trading around $1,937, down about 1% on the day, as the market consolidates following a sharp selloff in early February.
summary
- Ethereum is trading around $1,937, consolidating below the important $2,000 level after a sharp selloff in early February, and the overall bearish trend remains in place on the daily chart.
- ETHZilla has launched the first tradable tokenized aviation asset on Ethereum, powered by a jet engine leased to a major US airline, expanding the network’s real world asset (RWA) footprint.
- What technical indicators indicate $ETH It is below the 50-day SMA near $2,799, with support at $1,900 and $1,800, and resistance at $2,000 and $2,200.
This price movement came as ETHZilla announced the launch of the first-ever tradable tokenized aviation asset on Ethereum ($ETH) network, highlighting the growing role of blockchain in the tokenization of real-world assets (RWA).
ETHZilla brings aviation assets on-chain
ETHZilla has announced the launch of Eurus Aero Token I, a tokenized aviation product powered by jet engines currently leased to major US airlines. This asset provides partial exposure to income-generating aircraft engines and is issued on Ethereum infrastructure.
You may also like: XRP Price Prediction Ahead of Today’s January US CPI Report
The product is targeted at accredited investors and aims to provide benefits through the cash flow generated by the lease. By deploying assets on Ethereum, ETHZilla leverages the network’s smart contract capabilities to achieve transparency, automated distribution, and on-chain verification.
This move adds to the growing trend of institutions using Ethereum as a payment layer for tokenized real-world assets.
Ethereum price trend: bearish structure continues
According to the TradingView daily chart, Ethereum is still in a clear short-term downtrend.
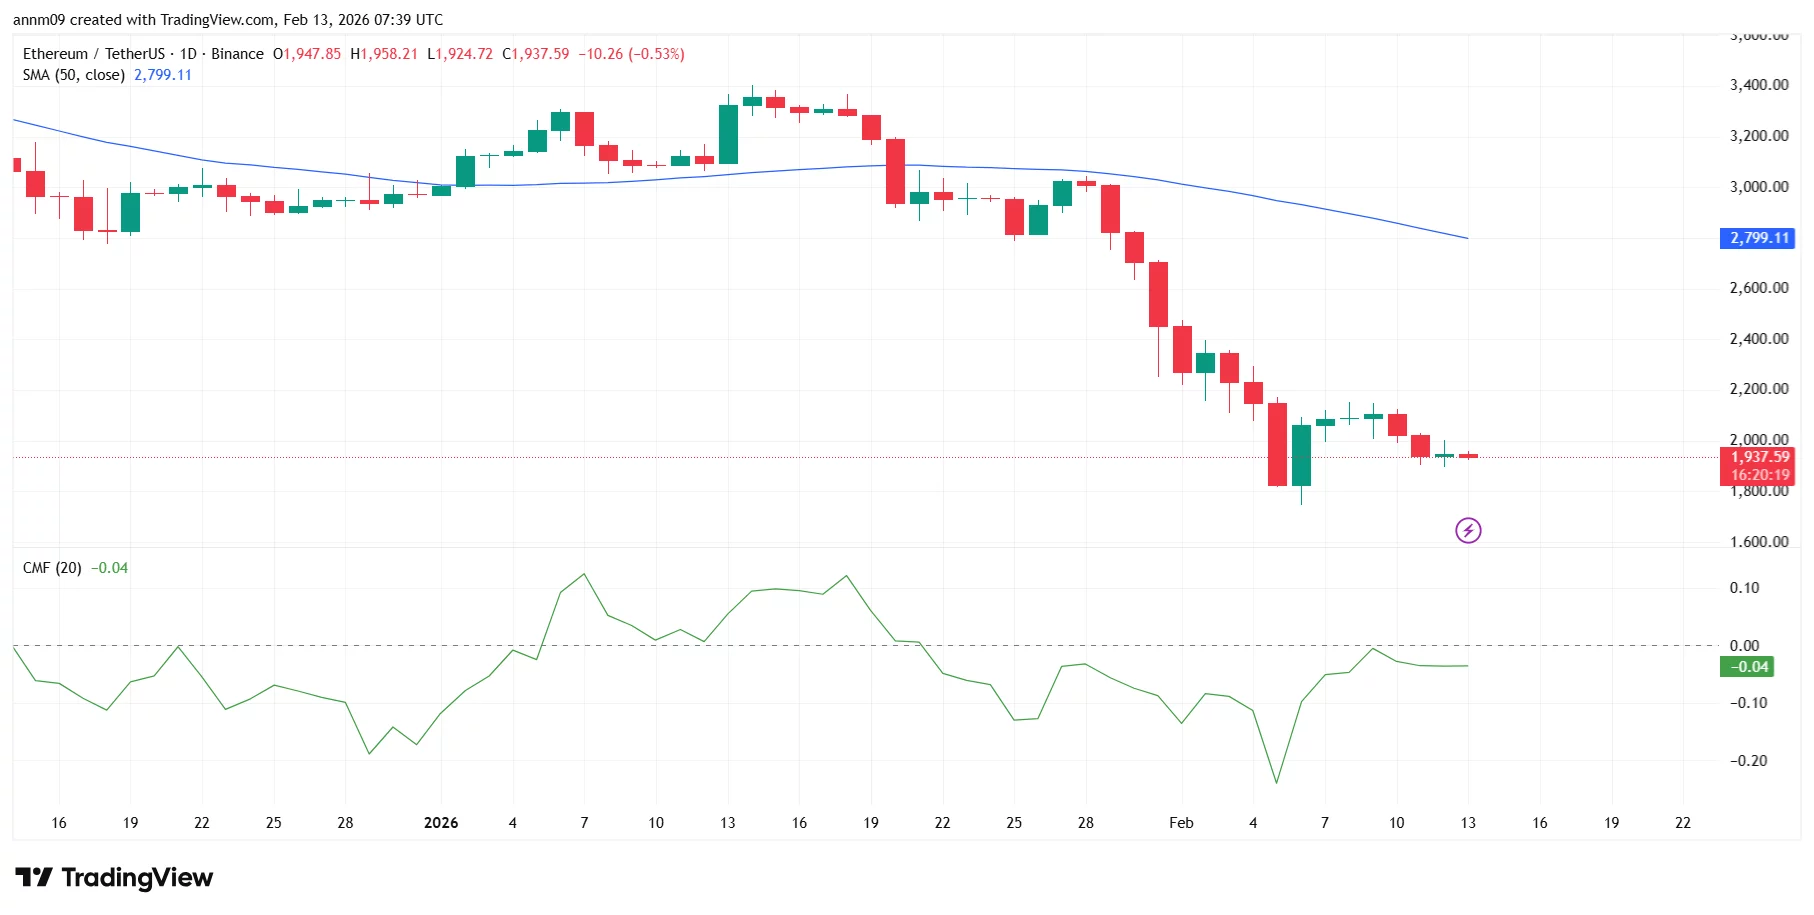
Ethereum price performance | Source: Tradingview
$ETH It remains well below its 50-day simple moving average (SMA), currently located around $2,799, indicating that the broader momentum remains bearish.
The chart shows a series of lower highs and lower lows since mid-January, with a sharp breakdown occurring in early February that sent the price below the $2,400 and $2,200 levels.
A sharp rally towards the $1,800 zone marked a recent swing low before buyers intervened. However, the rebound has been modest and the price is currently consolidating just below the psychological $2,000 level.
The Chaikin Money Flow Indicator is around -0.04, almost neutral, but still slightly negative. This suggests that capital inflows have not yet definitively returned, and caution is intensifying.
Immediate support is near $1,900, followed by recent lows near $1,800. A break below this zone could expose further downside towards the mid-$1,700s.
On the positive side, $ETH It will face first resistance near $2,000 and stronger resistance near $2,200. A sustained move above these levels will be required to challenge the falling 50-day SMA near $2,800.
read more: SEC Chairman warns that some prediction markets may fall under securities laws