
Ethereum is expected to have over $500 million in net futures flows and is recording bullish momentum as the price tests key resistance levels.
Ethereum (ETH) is currently trading at $3,158, reflecting a 4.2% increase over the past 24 hours. Ethereum’s daily price range remains between $2,941.77 and $3,171.62, indicating a significant upward trend within a narrow price range.
Over the past week, Ethereum has gained 11.3%, and its 14-day performance shows an 11.5% gain. ETH currently boasts a market capitalization of $381.18 billion and a circulating supply of 120.7 million ETH.
As Ethereum continues its upward trajectory, the focus is on price action around $3,150. The recent price rally signals signs of bullish continuation as Ethereum tests higher resistance levels. Will ETH break through these key resistance points and push towards new highs?
Ethereum price analysis
Ethereum’s daily chart reveals that the technical outlook is mixed as the price is currently testing a key resistance level near $3,200. The Ichimoku cloud indicates that the price is moving within the cloud based on $3,093. Immediate supportand $3,437.71 is showing higher resistance.
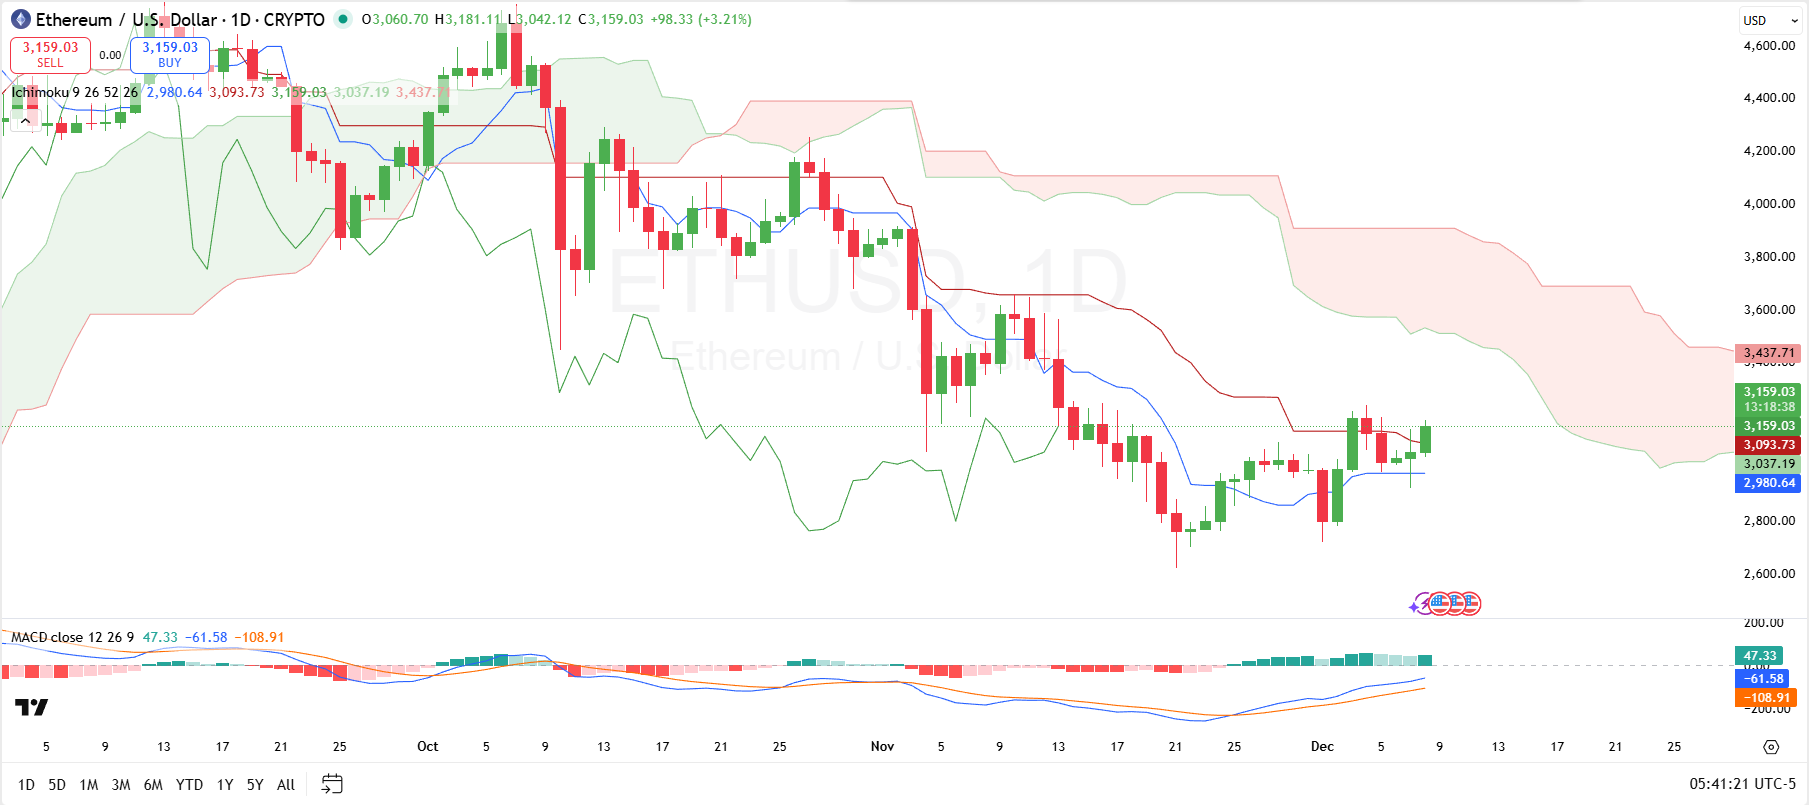
Ethereum daily price chart
Ethereum is currently at the lower end of the cloud, and if it sustains above $3,159.03, it could push towards the resistance at $3,437.71. However, a decline below $3,037.19 could trigger a move towards the cloud’s lower bound, suggesting $3,037 as the next key support level.
Additionally, the conversion line is at $2,980 and the baseline is $3,093. If the tonk line rises above the reference line, it is usually considered a bullish signal.
On the other hand, the MACD is showing a bullish signal as the histogram turns positive and the MACD line is above the signal line, indicating that upward momentum is increasing. However, the RSI remains in the neutral zone at 47.33, indicating that Ethereum is neither overbought nor oversold.
This neutral RSI reading suggests that while prices are trending up, there is still room for further price action before encountering significant resistance.
Ethereum futures flow
Elsewhere, Ethereum’s 12 hours liquidity data had a significant net inflow of $512.38 million, with inflows of $6.706 billion and outflows of $6.24 billion, resulting in a change of +275.88%. This surge in inflows indicates strong buying pressure over a 12-hour period.
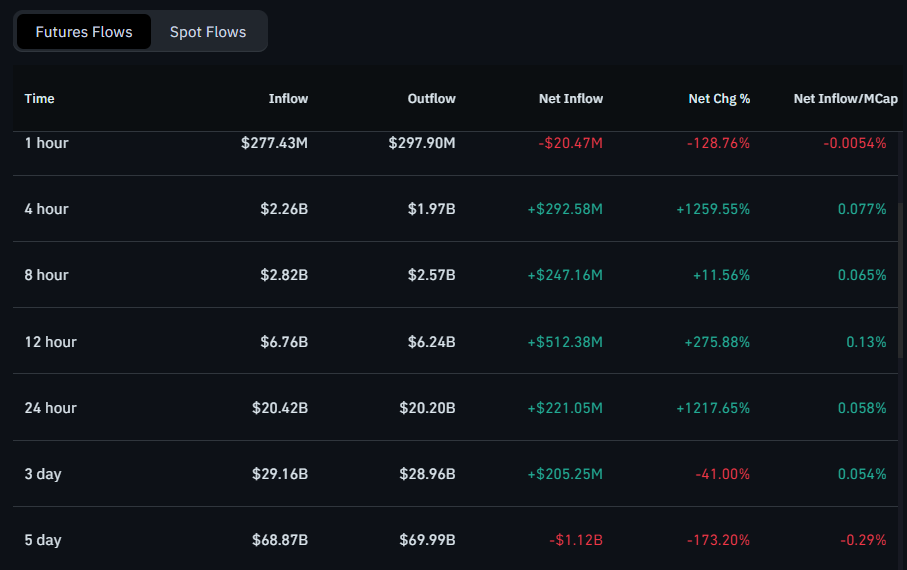
Ethereum liquidity chart
Looking at the 24-hour data, Ethereum saw inflows of $20.42 billion and outflows of $20.2 billion, resulting in a net inflow of $221.05 million, a change of +1217.65%. Although the total inflows and outflows are large, the net inflows show that Ethereum still has more buyers than sellers.
According to the three-day data, net inflows were $205.25 million, with inflows of $29.16 billion and outflows of $28.96 billion. However, this data shows a change of -41.00%, reflecting a decrease in the net inflow rate compared to the shorter period.