
Ethereum remains under bearish pressure on the daily chart, with traders waiting to see if resistance breaks and momentum improves after the recent liquidation.
Ethereum ($ETH) is trading at $1,967.04, down 1.6% in the past 24 hours, with price action reflecting a volatile session and ultimately trending bearish. The 24-hour range is from a low of $1,927.71 to a high of $2,030.77, indicating quite wide intraday fluctuations. $ETH It briefly crossed the $2,000 area before moving back towards the midrange.
In terms of activities, $ETH indicates a 24-hour trading volume of $22.48 billion and a market cap of $237.34 billion. Also shows performance tiles $ETH It was down 0.4% in 1 hour, up 0.1% in 7 days, down 6.7% in 14 days, and down 38.0% in 30 days. This performance has made traders cautious and attention has shifted to: $ETH can be taken back Intraday resistance is at $2,000.
Can Ethereum test $2,000 again?
From a technical perspective, Ethereum remains under broad bearish pressure on the daily chart, with the price trading well below both the 50-day EMA of $2,512 and 100-day EMA of $2,834. These moving averages are downward sloping, reinforcing the general downtrend and acting as a dynamic resistance zone as it attempts a recovery.
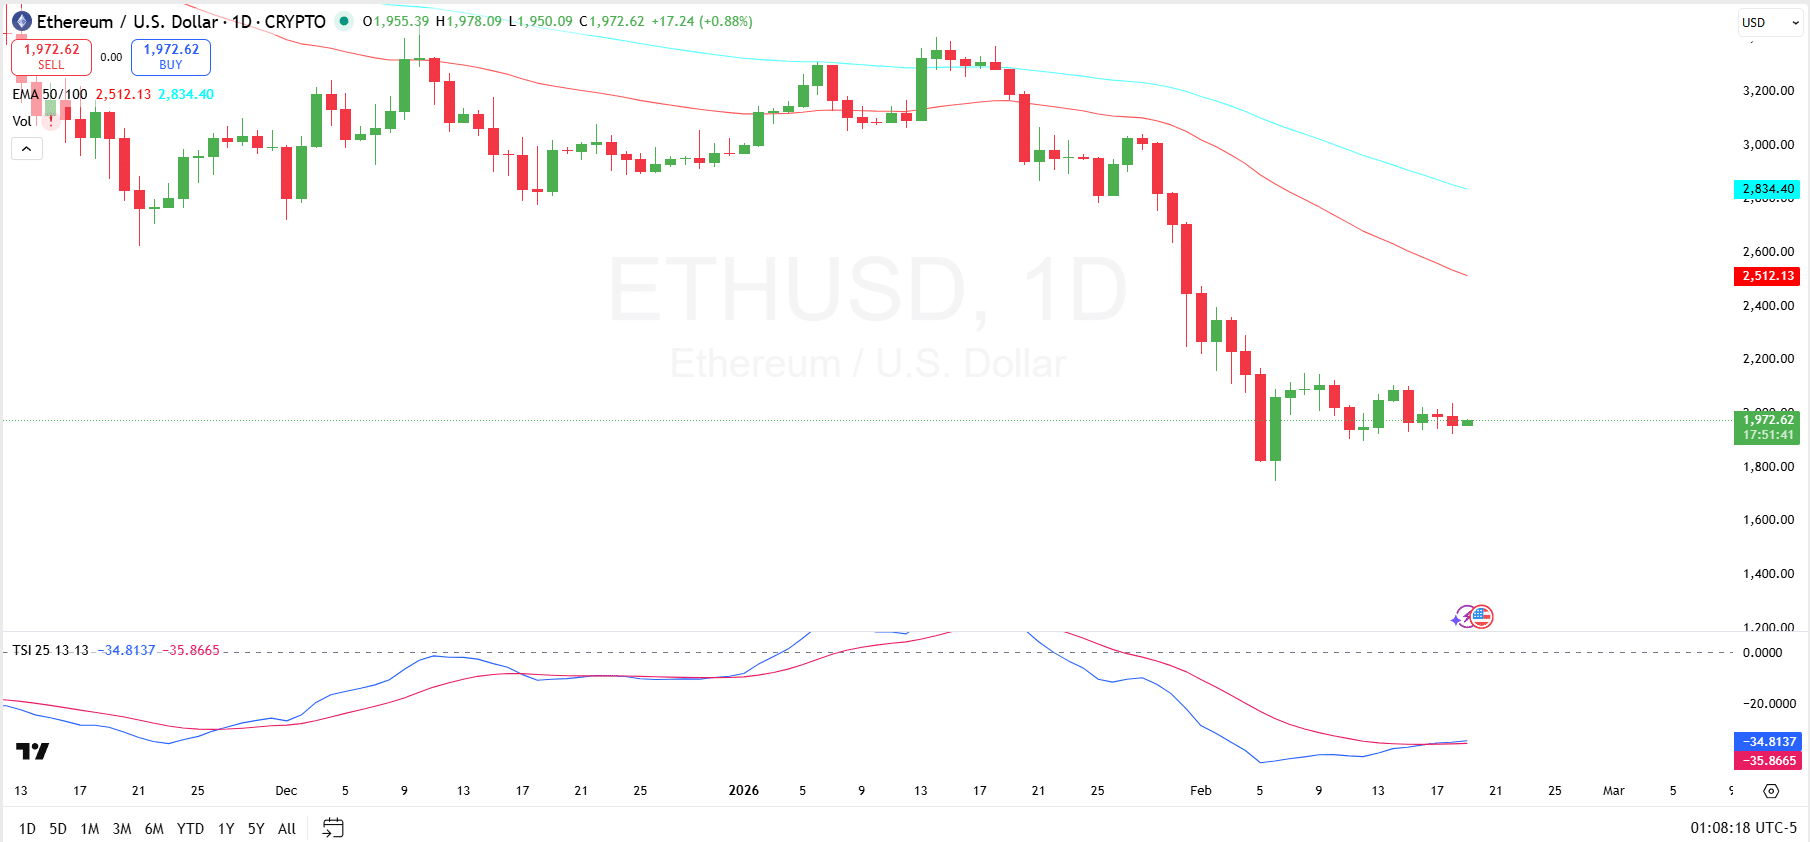
Ethereum 1D chart
Near-term horizontal resistance is currently located around $2,100-$2,200, but there is still strong overhead pressure near the 50-day EMA. On the downside, recent price action shows support forming around $1,825 and a deeper support zone around $1,750, where buyers were previously actively intervening.
Currently, the True Strength Index (TSI) is reading around -34 on the main line and -35 on the signal line, both of which are well below the zero level. Although this reflects sustained bearish momentum, the line appears to be flattening slightly, suggesting that the downward momentum may be stabilizing.
A bullish signal requires a crossover above the signal line and a return to the zero axis, but a sustained rejection below zero confirms that the sellers are still in control of the trend.
Ethereum clearing data
ethereum Clearing data shows that the longer the time frame, the sharper the imbalance, with total liquidations reaching $60.24 million in the past 24 hours. Of this amount, long positions accounted for $42.68 million, significantly exceeding short liquidations of $17.56 million.
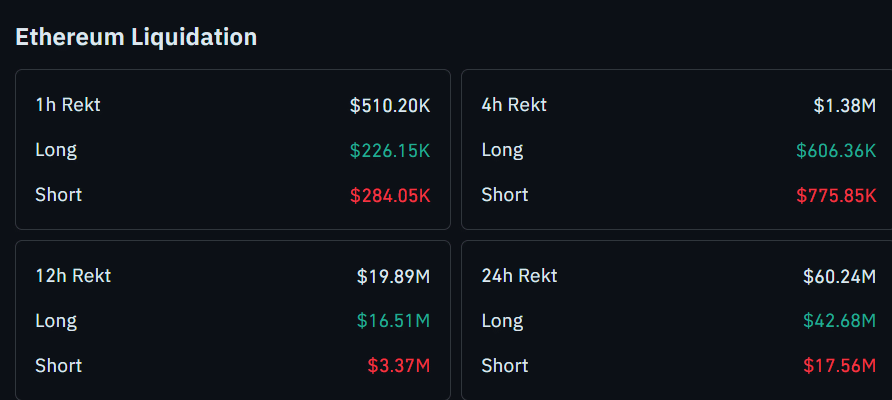
$ETH liquidation
On the shorter time frame, the 12-hour settlement amount was $19.89 million, again dominated by short $3.37 million versus long $16.51 million. However, on the 1-hour and 4-hour time frames, liquidations appear to be more balanced, with a slight increase in short-term liquidations in both periods. Four-hour data shows total liquidations of $1.38 million, shorts of $7.7585 million, and longs of $6.0636 million, indicating near-term pressure on shorts amid broader long-side pressure.