
Ethereum price is trading around $2,995 today, hovering just above the key demand zone of $2,950 to $2,880 as sellers continue to put pressure on the structure heading into November 19th. The market is still trapped in a clear downtrend, with the downtrend line dominating price movements and the EMA cluster reinforcing bearish control.
ETH breakdown expands as sellers defend trend line
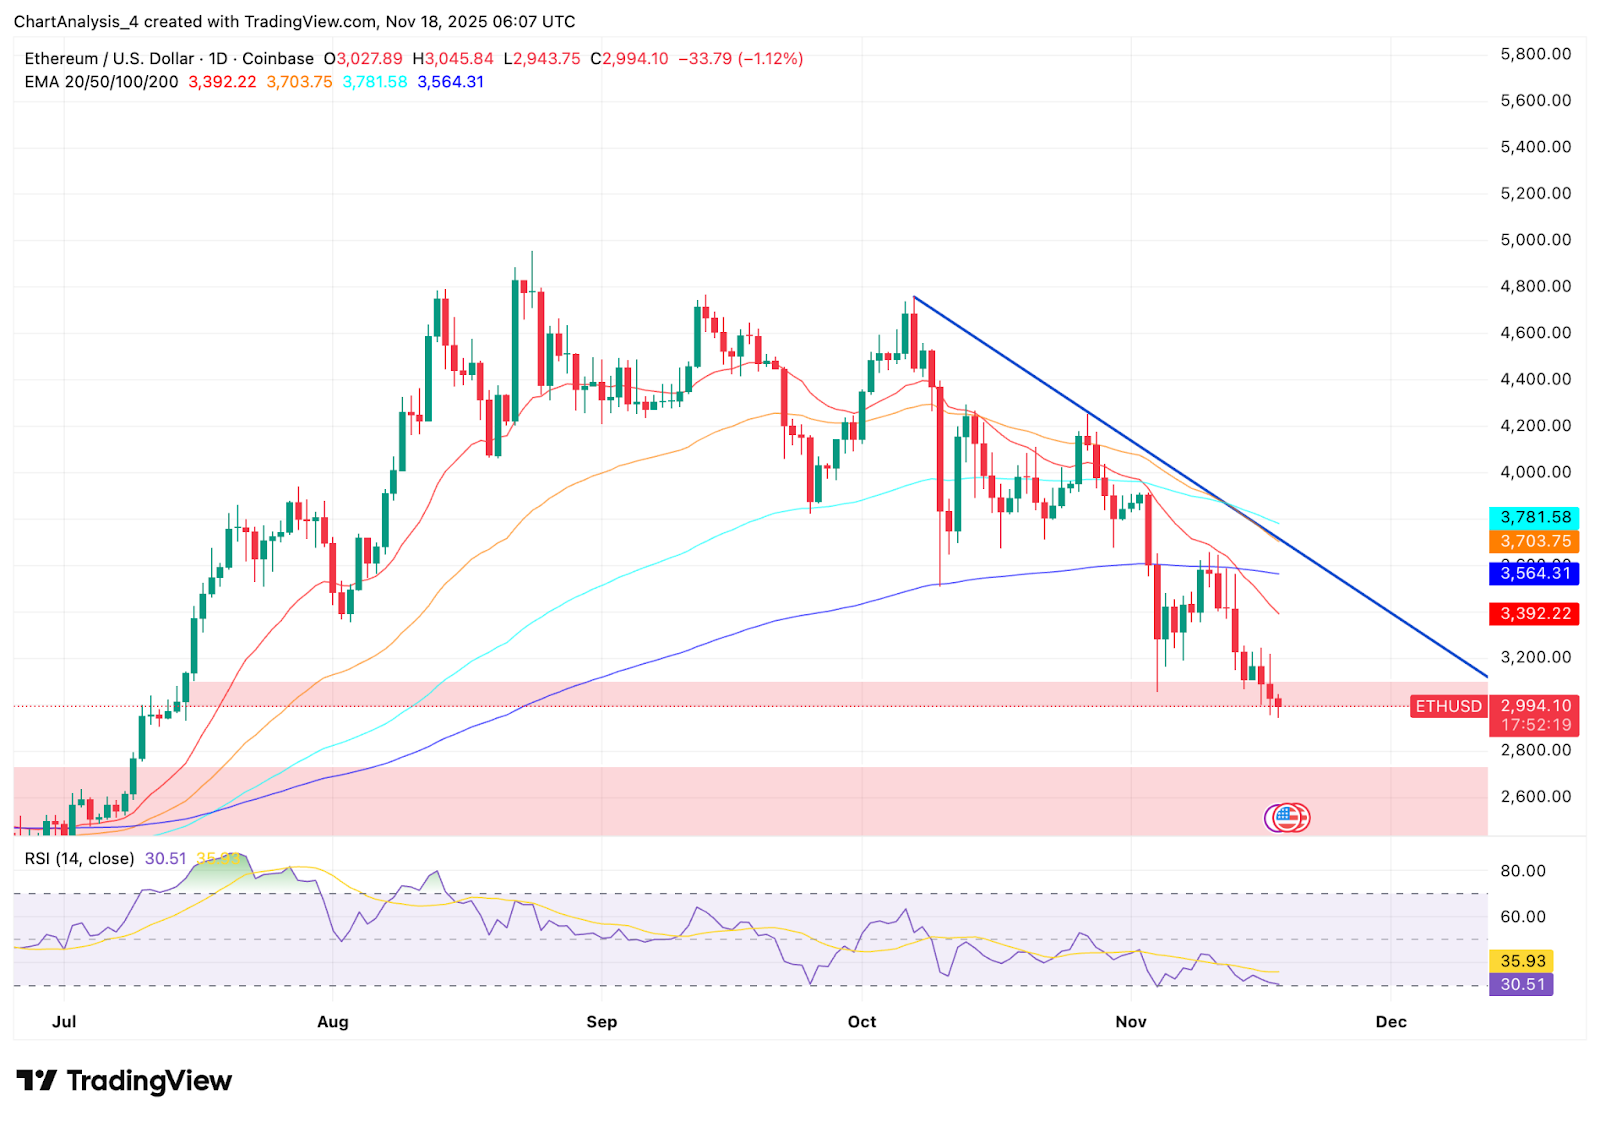
ETH price fluctuation (Source: TradingView)
Ethereum has failed to break out of the downtrend line that has capped any pullbacks since early October. Each attempt to move up from $3,350 to $3,450 has been rejected below this line, confirming a steady streak of highs.
Price is currently located below all major EMAs.
- 20EMA: $3,392
- 50EMA: $3,703
- 100EMA: $3,781
- 200EMA: $3,564
The slopes of these EMAs indicate consistent downward pressure, but the daily candlesticks have remained below the 200-day average for over two weeks. This confirms that buyers have lost control over the medium term and the market is responding to forced flows rather than risk appetite.
Related: Dogecoin Price Prediction: Downtrend deepens as DOGE struggles to maintain support
The RSI is near 30, indicating that the market is approaching oversold territory, but there has not been a breakaway strong enough to cancel the overall trend.
Spot outflows increase as selling pressure continues
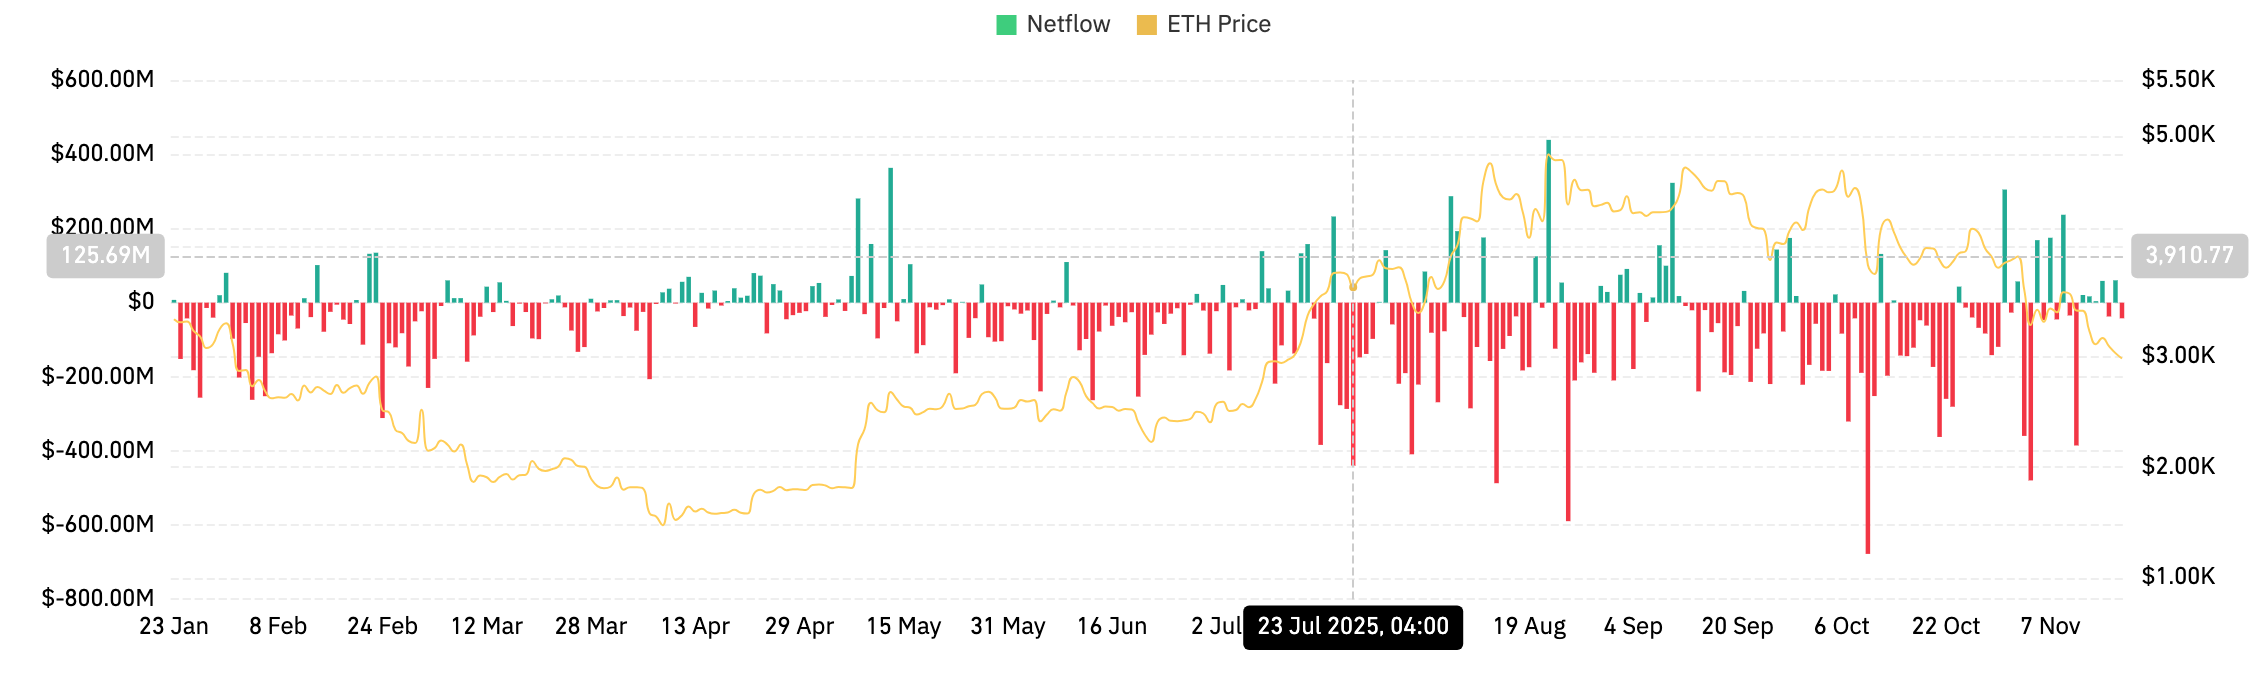
ETH Netflows (Source: Coinglass)
According to data from Coinglass, Ethereum recorded net outflows of $27.56 million on November 18, reinforcing the selling bias seen over the past week.
Most of the November session was tilted toward outflows, suggesting investors continue to reduce exposure rather than accumulate weakness.
This is consistent with a broader pattern of red outflow bars dating back to late October, when a break below the 200-day EMA first triggered a rotation in ETH. Increased outflows during macro downtrends typically confirm that spot sellers, not just derivative liquidations, are pushing prices up.
Intraday momentum shows weak attempts at stabilization
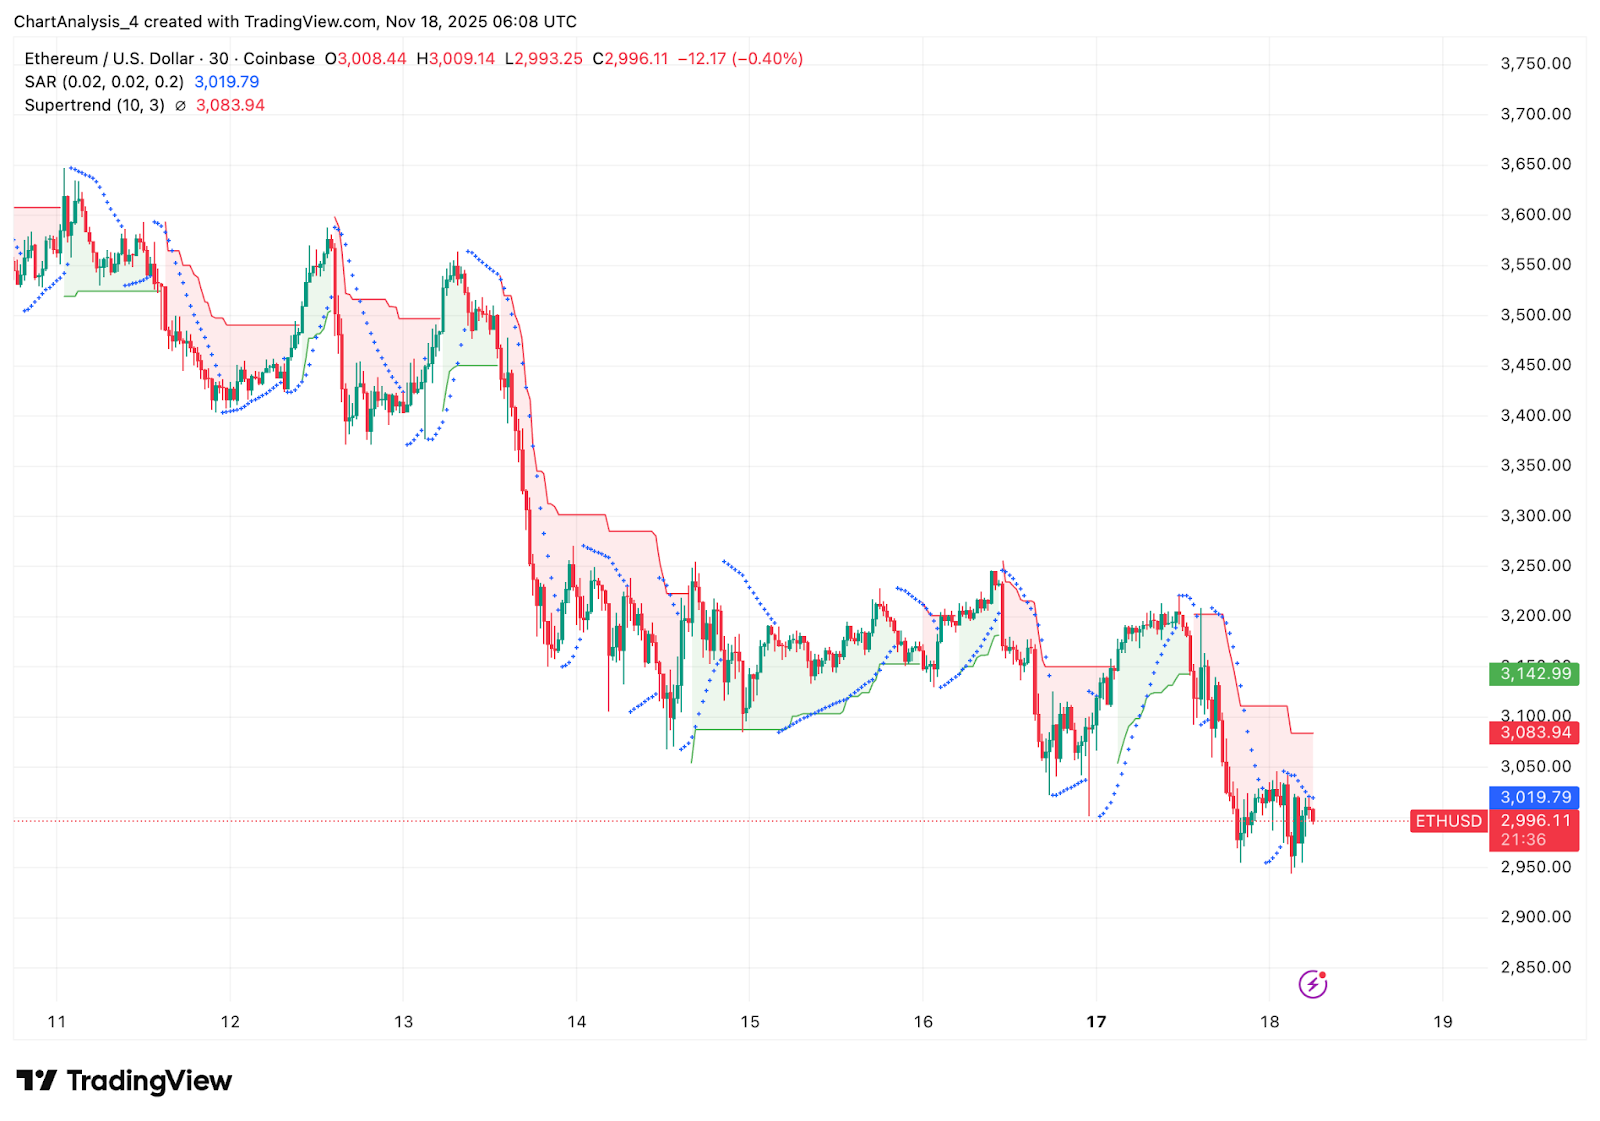
ETH short-term price trend (Source: TradingView)
Looking at the short-term chart, ETH is trying to stabilize above $2,980, but the recovery remains shallow. On the 30-minute time frame, the supertrend sits overhead at $3,083, forming a ceiling that rejects any microbounces.
Parabolic SAR is above price, confirming that the downside momentum is still active. Each attempt to recover from $3,050 to $3,100 quickly stalls as sellers lean into intraday bearish structure.
Related: Solana Price Prediction: SOL Prices Face Pressure as Market Structure Weakens
For buyers to gain a foothold, ETH needs a close above $3,083 to reverse the supertrend. This will mark the first sign of seller momentum drying up. Until that happens, meetings remain corrective rather than constructive.
outlook. Will Ethereum go up?
Ethereum trends remain bearish heading into November 19th, with the burden of proof shifting entirely to the buyer.
- Bullish case: ETH holds above $2,950, regaining $3,083 and breaking above $3,392. If this happens, the short-term momentum could reverse and the downtrend line could attempt another breakout.
- Bearish case: A daily close below $2,950 exposes $2,800, followed by a deeper support zone near $2,600. If it stays below the EMA, the entire structure will remain tilted downward.
Buyers will regain control if ETH regains $3,083 and crosses the 20 EMA. A loss of $2,950 confirms the continuation of the downtrend.
Disclaimer: The information contained in this article is for informational and educational purposes only. This article does not constitute financial advice or advice of any kind. Coin Edition is not responsible for any losses incurred as a result of the use of the content, products, or services mentioned. We encourage our readers to do their due diligence before taking any action related to our company.