
Bitcoin’s recent rally above $110,000 is facing headwinds. Key on-chain metrics reveal that capital inflows are starting to slow, casting doubt on the near-term sustainability of the rally.
Bitcoin is currently trading around $111,200, perched precariously within key price ranges that analysts recognize as crucial in determining the next big move. The sideways investor momentum highlighted by CryptoQuant data suggests that the underlying bid price may be weakening and could potentially be ready to test the lower bound of support.
On-chain signal: CryptoQuant P&L index shows flattening of Bitcoin inflows
Think of market momentum like water pressure. If there is a large amount of inflows, prices will rise, but if the pressure subsides, it will be difficult to maintain current levels. CryptoQuant CEO Ki Young Ju points out this very scenario that is currently unfolding. He highlights the Bitcoin Profit and Loss Index, a metric that tracks total investor profitability and momentum, which started to plateau in October after recovering at the beginning of the year.
Bitcoin capital inflows are slowing down again. pic.twitter.com/UBreC1bAwR
October 24th
This flattening, visualized in the 365-day moving average, is not necessarily a sign of a crash, but it is a significant warning. This suggests that the wave of new money chasing Bitcoin’s rise has waned.
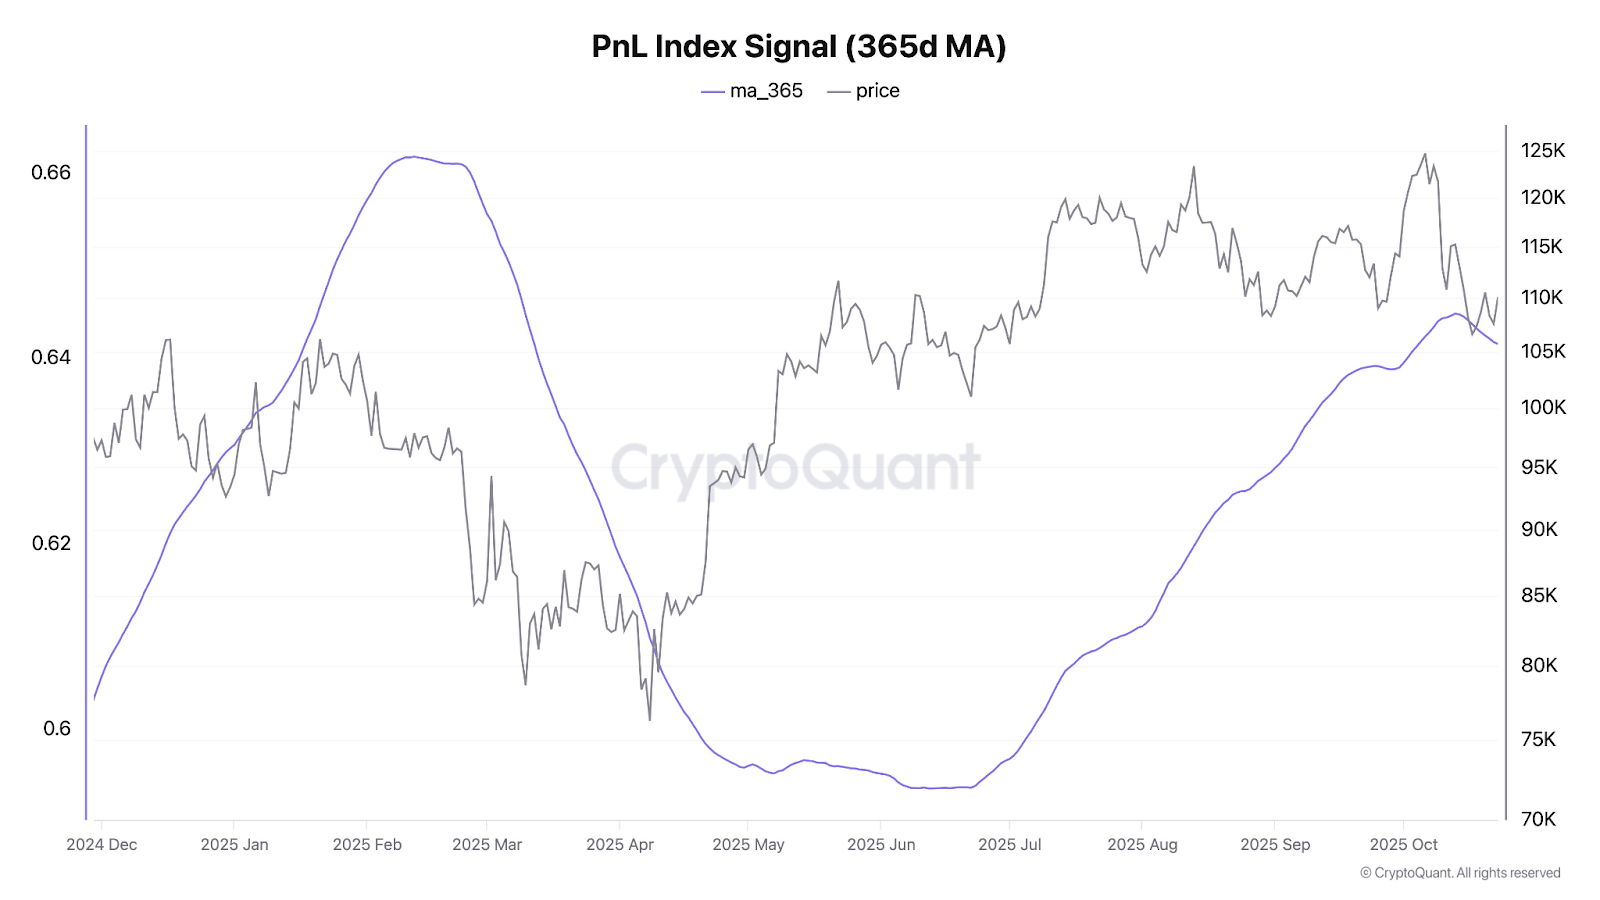
After strong growth in late 2024 and early 2025, there was a sharp decline in May and a recovery in mid-year, but this new stagnation suggests that investors’ appetite for investment may reach a plateau in the short term. If new inflows don’t boost demand, the market is likely to fall.
Related: Bitcoin price prediction: BlackRock adds $73 million to holdings
Swissblock defines $109,000 to $114,000 as BTC’s “cost-based battleground”
Analytics firm Swissbloc described Bitcoin’s current price range of $109,000 to $114,000 as a “cost-based battleground” for most holders. Holding this level could signal the start of a reaccumulation phase, while falling below this level could trigger a broader decline.
Bitcoin’s battleground is set between $109,000 and $114,000, which is the cost-based zone for most holders.
This range defines the delicate market balance.
Keep the above → Re-accumulation phase
Loss → Downside risk againThis is a fine line between recovery and surrender. pic.twitter.com/zFjz1IuPzS
— Swiss Block (@swissblock__) October 23, 2025
Glassnode data also shows concentrated selling in the same range, indicating traders are hedging for strength rather than adding exposure.
Source: Glassnode
Standard Chartered repeats dip call below $100,000 before next rally
Meanwhile, Standard Chartered’s Jeffrey Kendrick warned that Bitcoin could briefly fall below $100,000 before recovering, noting that the recent pullback from October’s $126,000 high is a healthy correction within a long-term uptrend.
According to TheBlock, Kendrick said that such a sharp selloff could present a “buy on the buy” opportunity, and that this could be the last time Bitcoin trades below six digits.
BTC Price Analysis: Holding $104,000 Support Will Be Important
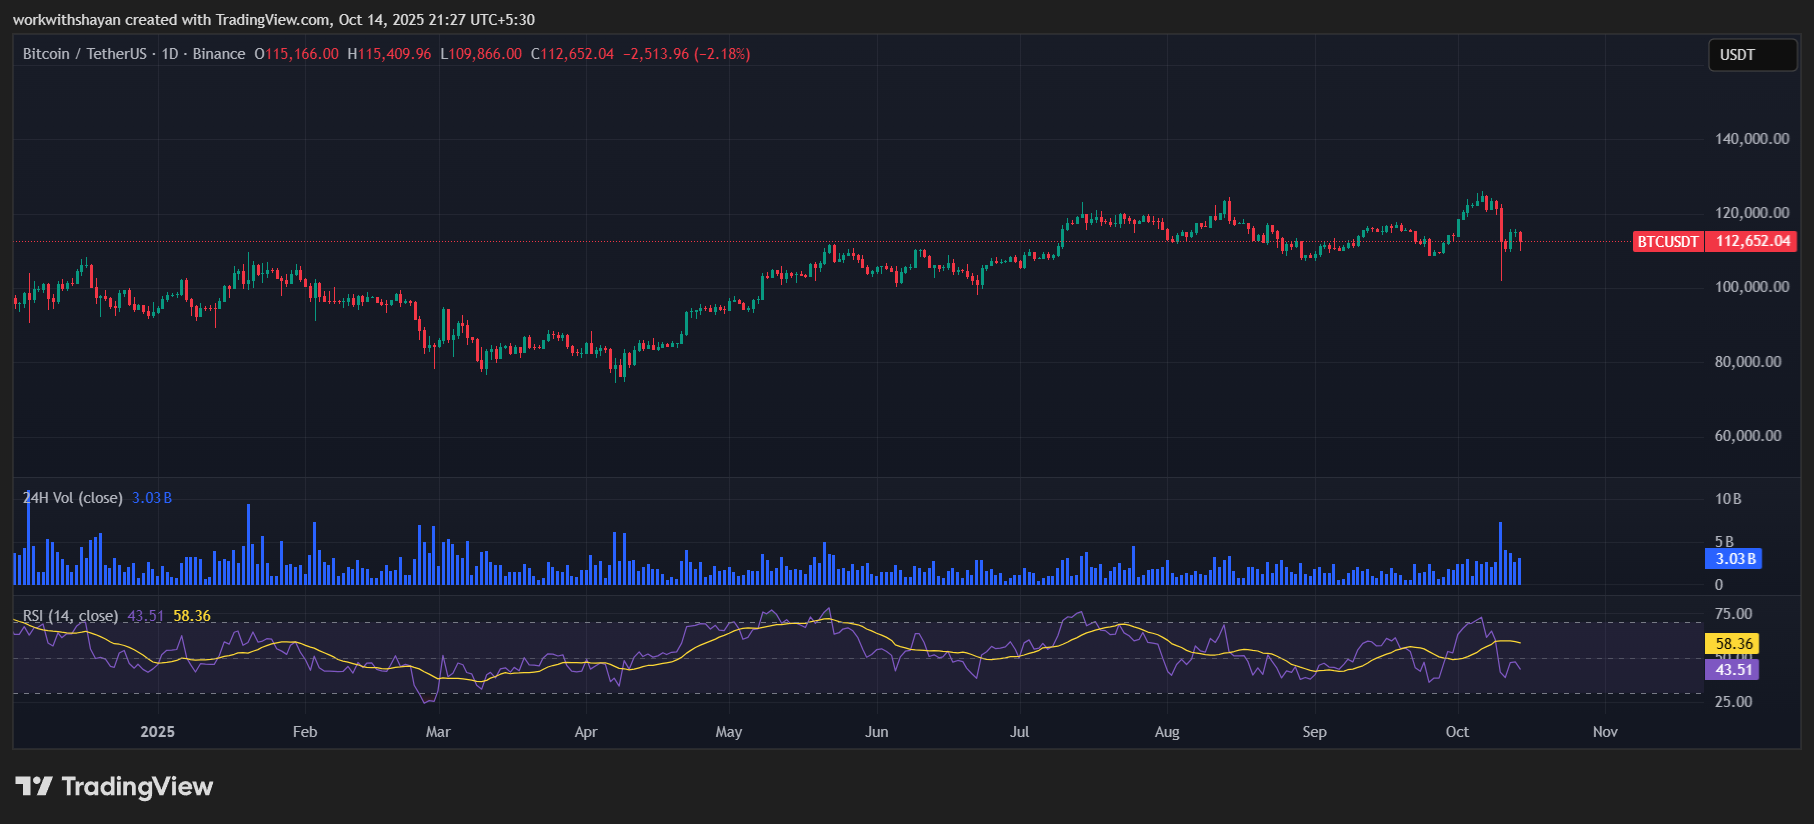
Looking at the daily chart, Bitcoin’s current consolidation around $111,000 reflects this uncertainty. Prices remain trapped within the descending channel established since the rejection from $126,000 in mid-September.
Immediate resistance is near $113,500. A decisive breakout above this level and subsequent breakout of the channel border near $125,000 (which also coincides with the resistance above the Bollinger Band) is required to override the bearish warning and target the all-time high near $130,000.
On the downside, a key support zone is located around $104,000. This level represents the lower trendline of a descending channel and roughly coincides with the 100-day moving average. A break below $104,000 would significantly increase the chances of Kendrick’s sub-$100,000 forecast being met, potentially targeting the $96,000 area as a retest of the previous accumulation zone.
Current momentum indicators provide little direct direction. The RSI is hovering around 47 (neutral) and the MACD remains slightly negative but has flattened, suggesting stabilization. The balance of power (BoP) reflects a wait-and-see attitude due to slowing capital inflows, confirming that buying pressure is currently limited.
Related: Why did BTC, ETH, XRP, ADA fall in October and can they recover before Halloween?
Disclaimer: The information contained in this article is for informational and educational purposes only. This article does not constitute financial advice or advice of any kind. Coin Edition is not responsible for any losses incurred as a result of the use of the content, products, or services mentioned. We encourage our readers to do their due diligence before taking any action related to our company.