
Bitcoin (BTC) traders remain nervous as the cryptocurrency pioneer consolidates below $115,000. Liquidity heatmaps show short positions are crowded, with whales quietly increasing exposure ahead of Wednesday’s Federal Open Market Committee (FOMC) meeting.
Investors are betting on a 97.8% chance that the Fed will cut interest rates by a quarter of a percentage point (25 bps).
Liquidity increases ahead of FOMC as bears fall into trap
As of October 28, Bitcoin was trading between $114,473, calming down from last week’s $116,000 test. Analysts say the next big move may depend more on the Fed than on the charts.
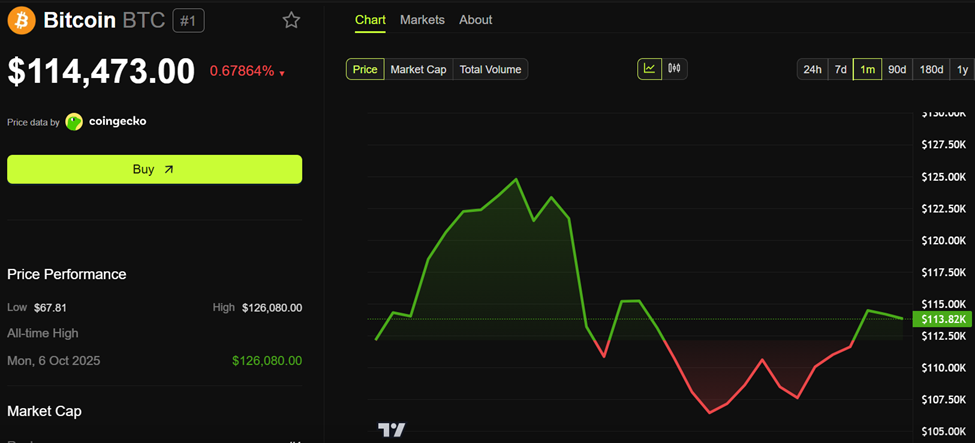
Bitcoin (BTC) price performance. Source: BeInCrypto
AlphaBTC market analyst Mark Cullen described the current situation as a “Bitcoin liquidity sandwich,” noting that short positions above the October 13 high are trapped.
“Attempts to build liquidity above the highs of the Monday 13th rebound will only worsen short-term liquidity as the bears piled on the sweep. They will be washed out again before a chance for a deeper correction arises,” Cullen wrote on X (Twitter).
Cullen’s analysis based on Coinglass’ liquidation heatmap shows increasing short-side pressure between $115,000 and $121,000, suggesting a possible squeeze ahead of a deeper correction.

Bitcoin liquidation heatmap. Source: Karen on X
This view reflects a broader bullish bias among traders, who expect a short-term “downfall” before hitting new highs.
Elsewhere, data aggregator CoinAnk warns that liquidation zones are tightening on both sides of the market, with heatmap tension increasing between $102,000 and $112,000.
“Thermal intensity in the 102,000-105,000 range rises to pink-orange color with extreme pressure on support…while the 108,000-112,000 band shows dense resistance,” the platform noted.
Such double-sided pressure often precedes sharp volatility in Bitcoin and reflects widespread trader indecision ahead of policy announcements.
Crypto Banter host Ran Neuner highlighted the CME futures gap at the $111,000 level, saying this is a zone that is often subject to retracement before a larger breakout.
“The CME differential is now down to the $111,000 level,” he teased.
According to TradingView data, CME Gap’s historical fill rate is 70%. Neuner’s comments suggest that Bitcoin’s current decline could precede a new rally, depending on whether the macro catalysts align post-FOMC.
FOMC looms as whales regain confidence
Data from the CME FedWatch tool shows that a rate cut at the FOMC meeting is almost certain.
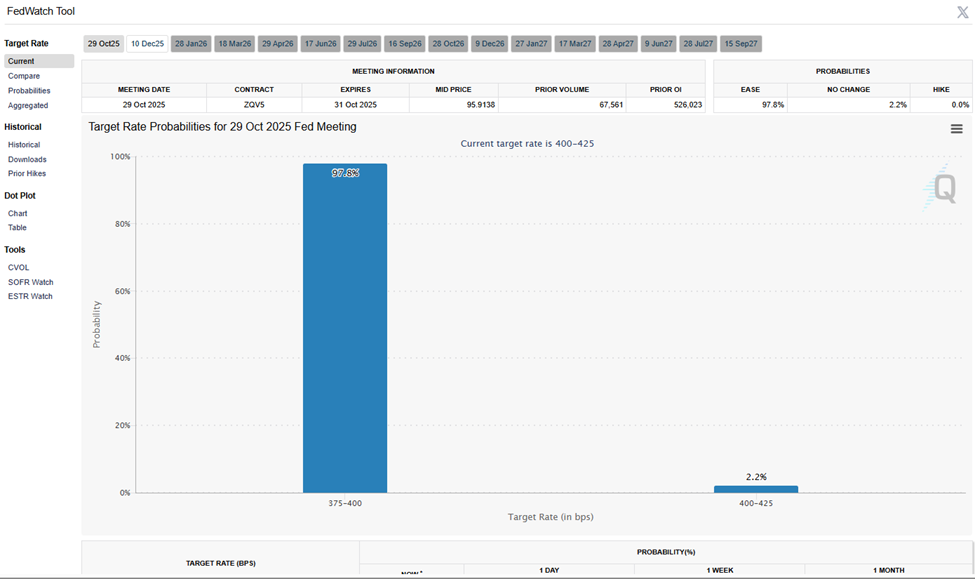
Possibility of interest rate cuts. Source: CME FedWatch Tool
Against this backdrop, trader Crypto Rover reminded his followers that a similar setup caused a “massive Bitcoin pump” in 2024. Expectations for a dovish pivot have revived bullish sentiment, especially among large companies.
Rover also revealed that the whale with a “100% win rate” added $237 million long BTC and $194 million long ETH, demonstrating deep belief that a short-term dip could be a buying opportunity.
“This whale is betting big on the upside after the FOMC,” Lorber said, “a signal that the smart money is expecting acceleration, not hesitation.”
Bitcoin’s order book tells a story of hesitation and hope as traders gain an advantage over the Fed. Bears see a crowded market ripe for a correction, while bulls are bracing for further upside, armed with liquidity maps and macro bets.
Nevertheless, this week will be an important one for Bitcoin, as predicted by Standard Chartered. The FOMC results could decide whether Bitcoin breaks out of the $110,000 to $116,000 range or sets off the next big sweep in crypto’s ongoing liquidity game.
The post Whales double down long as traders split ahead of FOMC as Bitcoin liquidity increases appeared first on BeInCrypto.