
In the cryptocurrency market, on-chain data and derivatives market trends indicate a wide divergence in investor behavior, while Bitcoin prices continue to move sideways with limited fluctuations.
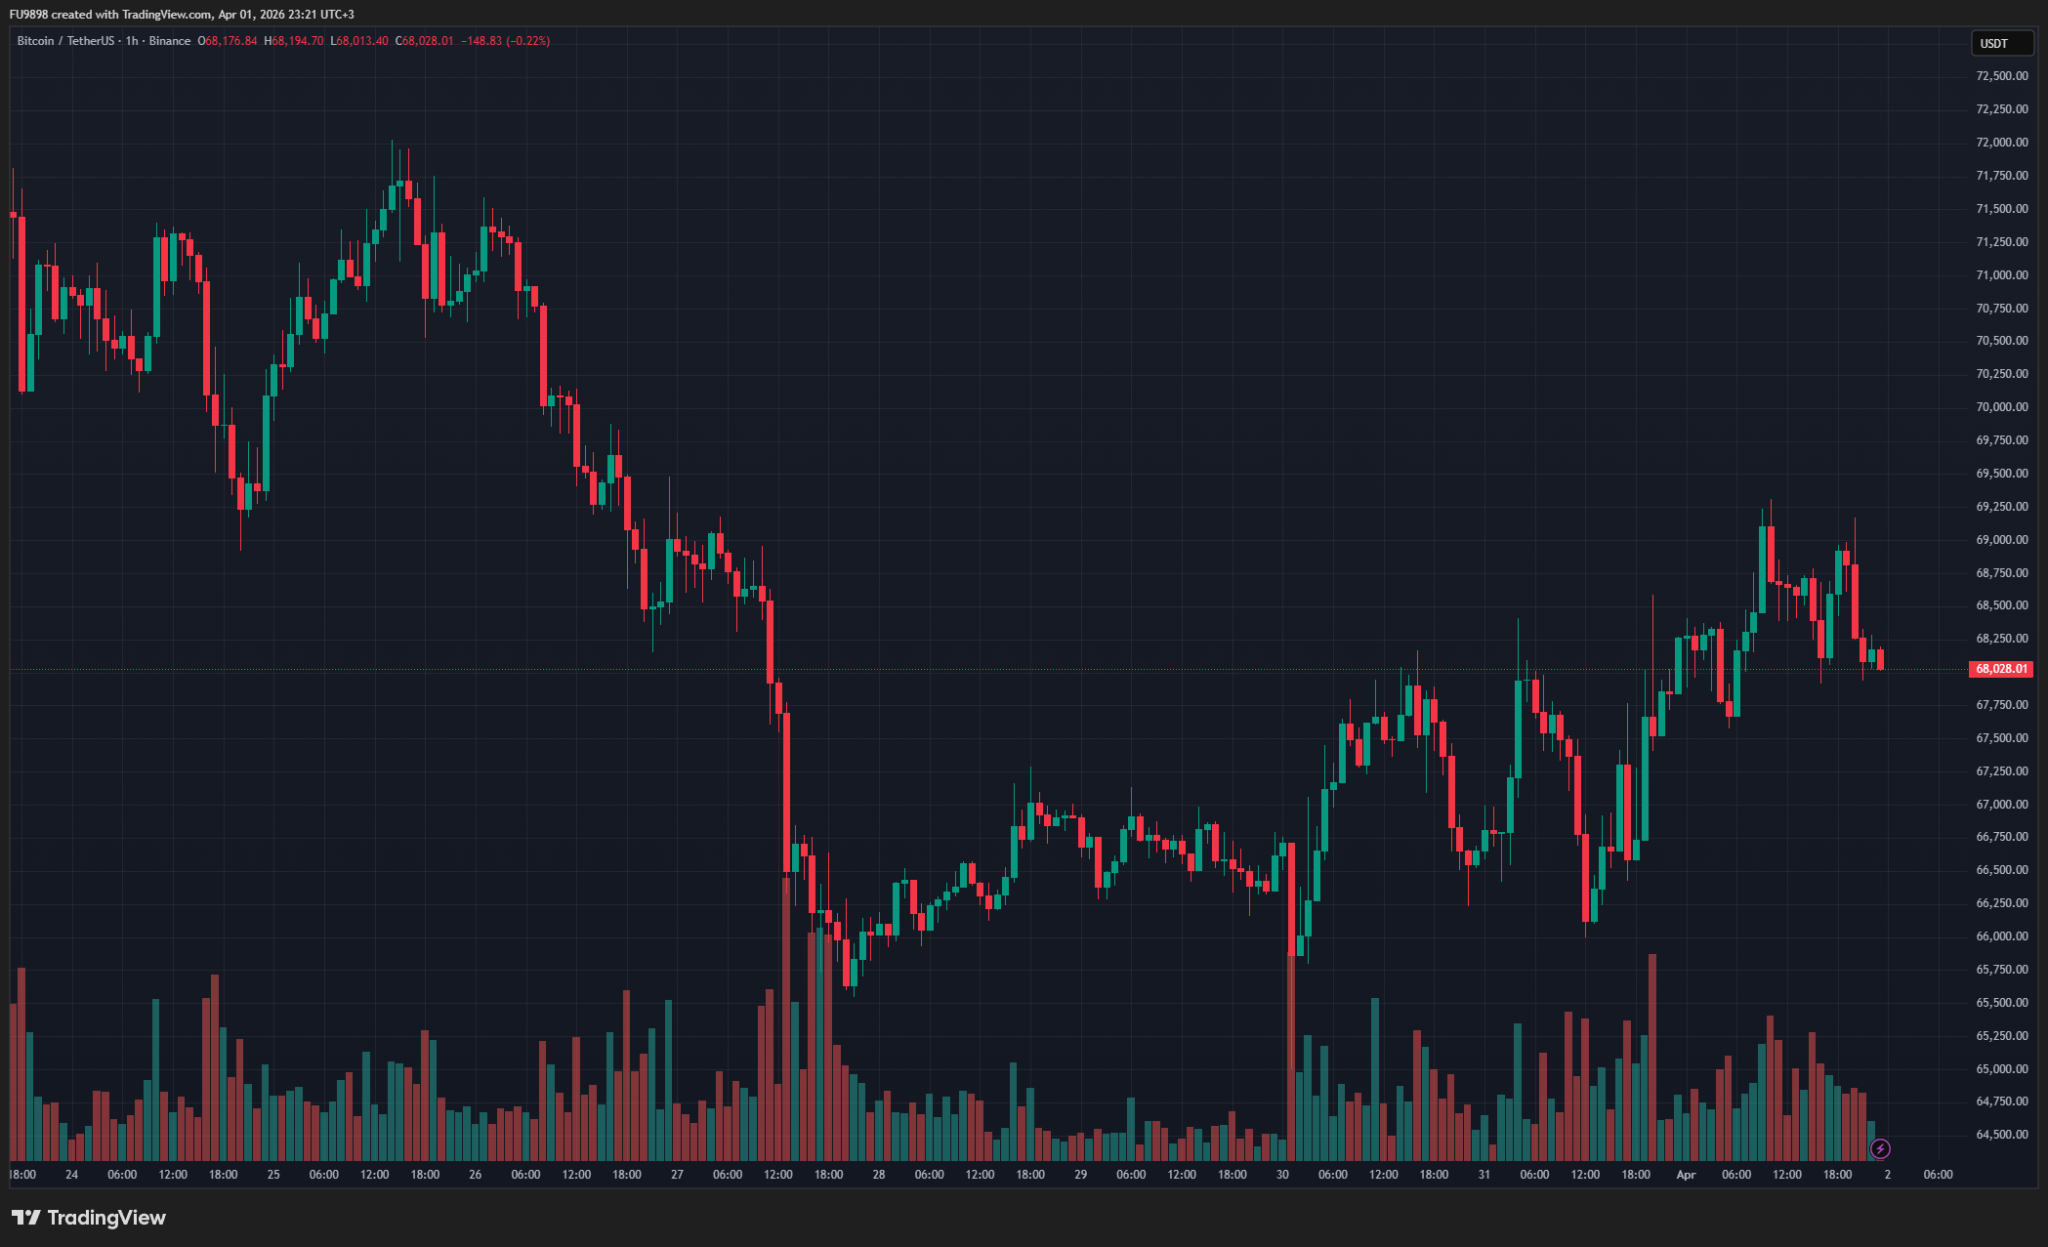
According to market data, Bitcoin ($BTC) is trading at $68,094, showing a limited increase of 0.06% in the past 24 hours.
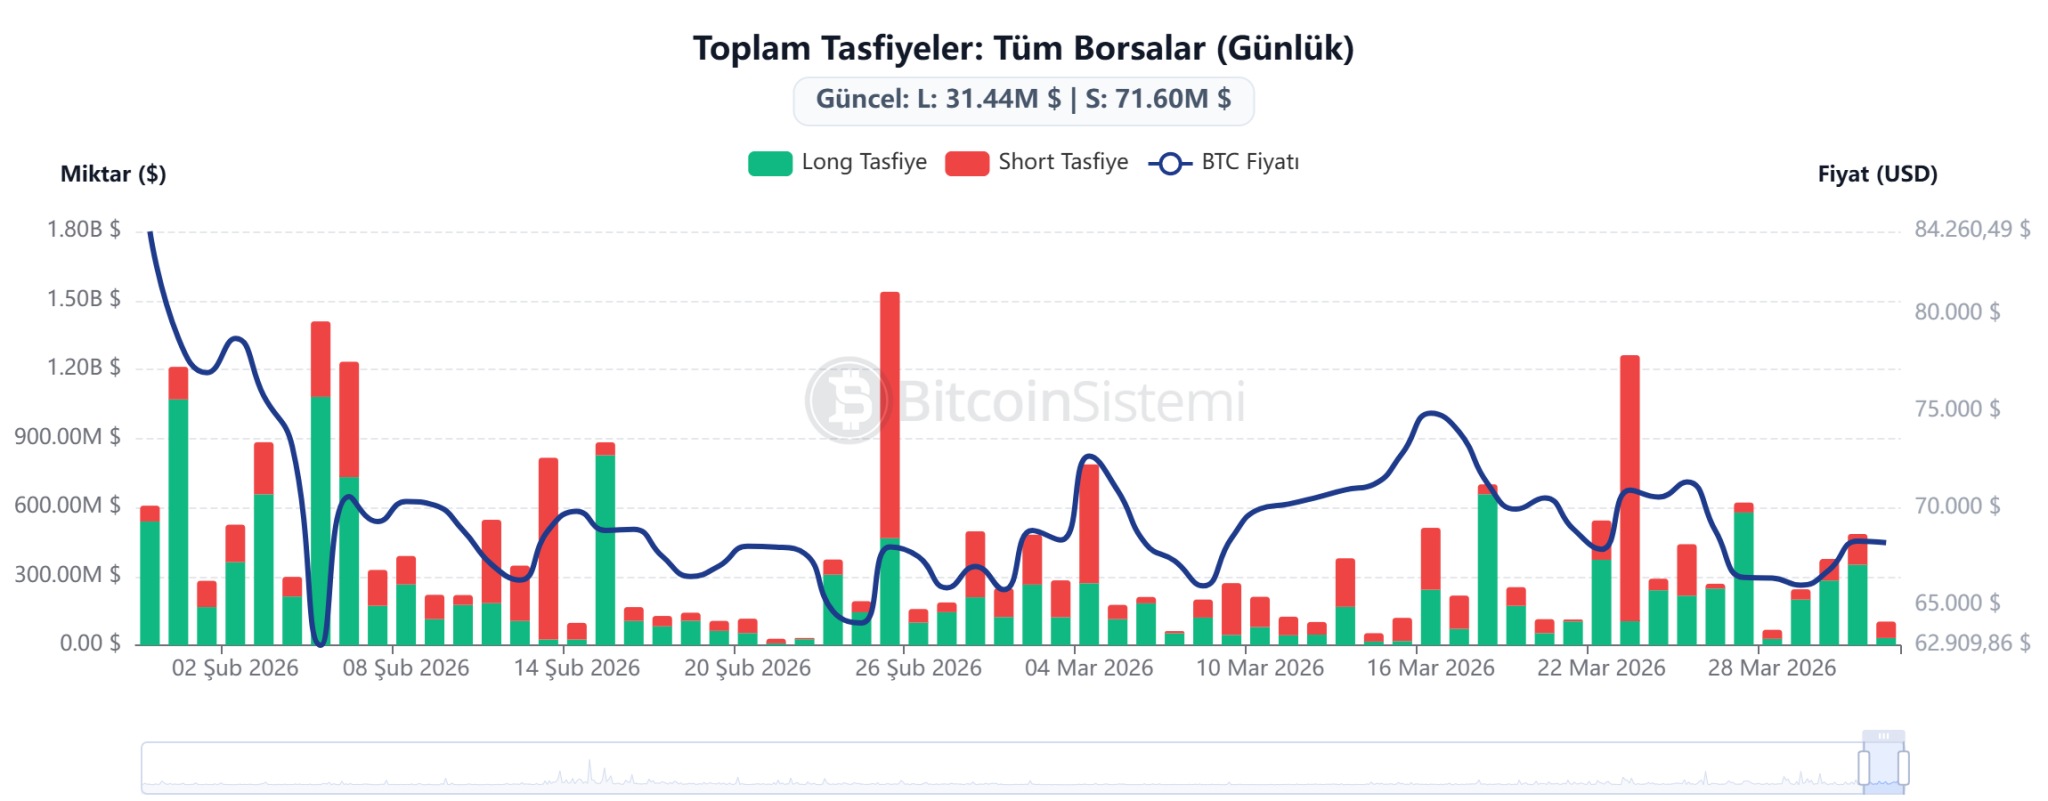
Clearings in the derivatives market present a remarkable situation during this period when prices remain within a narrow range. Short positions accounted for $76.51 million (70.1% of the total) in a total liquidation of $109.16 million, indicating that investors who took positions against the market rally were hit harder. In contrast, long-term liquidations were only $32.65 million.
You can access clearing data details here.
Meanwhile, the Fear and Greed Index, which measures market sentiment, remained in the “extreme fear” region at 8 points. The fact that the index is at similarly low levels yesterday (11), last week (14) and last month (10) indicates that investors are generally risk-averse and are approaching the market cautiously.
Related news What will happen to the price of Bitcoin once the war between the US and Iran ends? Here are the experts’ predictions
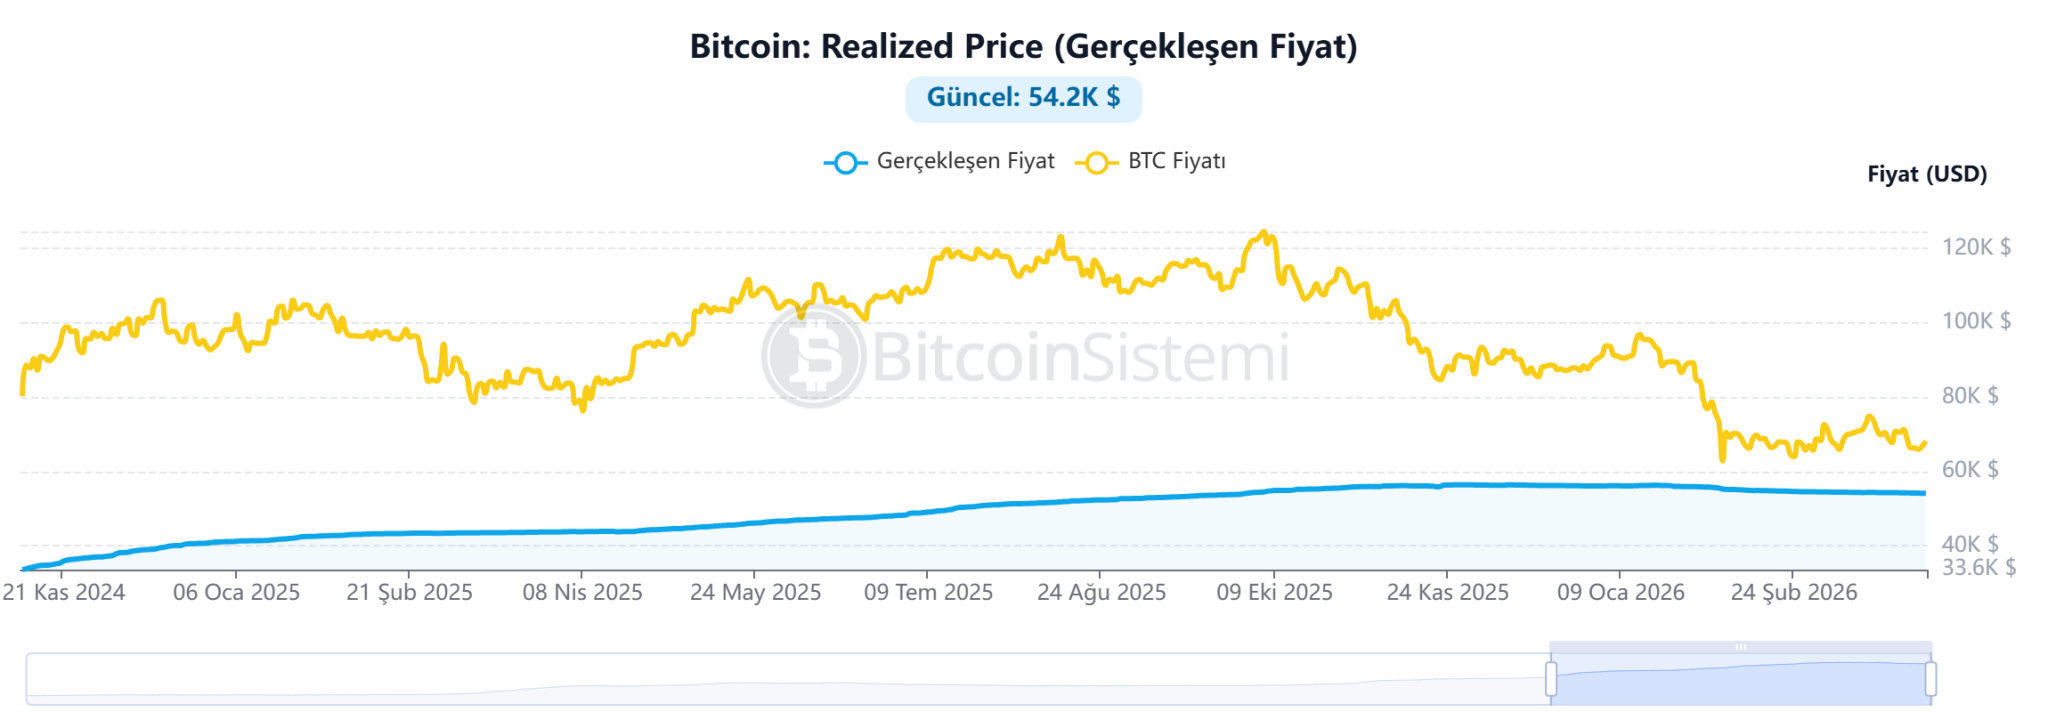
On-chain data shows that Bitcoin’s current price structure is relatively robust. The “realized price”, which represents the average cost of all investors on the network, is $54,200, and Bitcoin trading above this level is an indication that the market is generally profitable and this level could act as strong support.
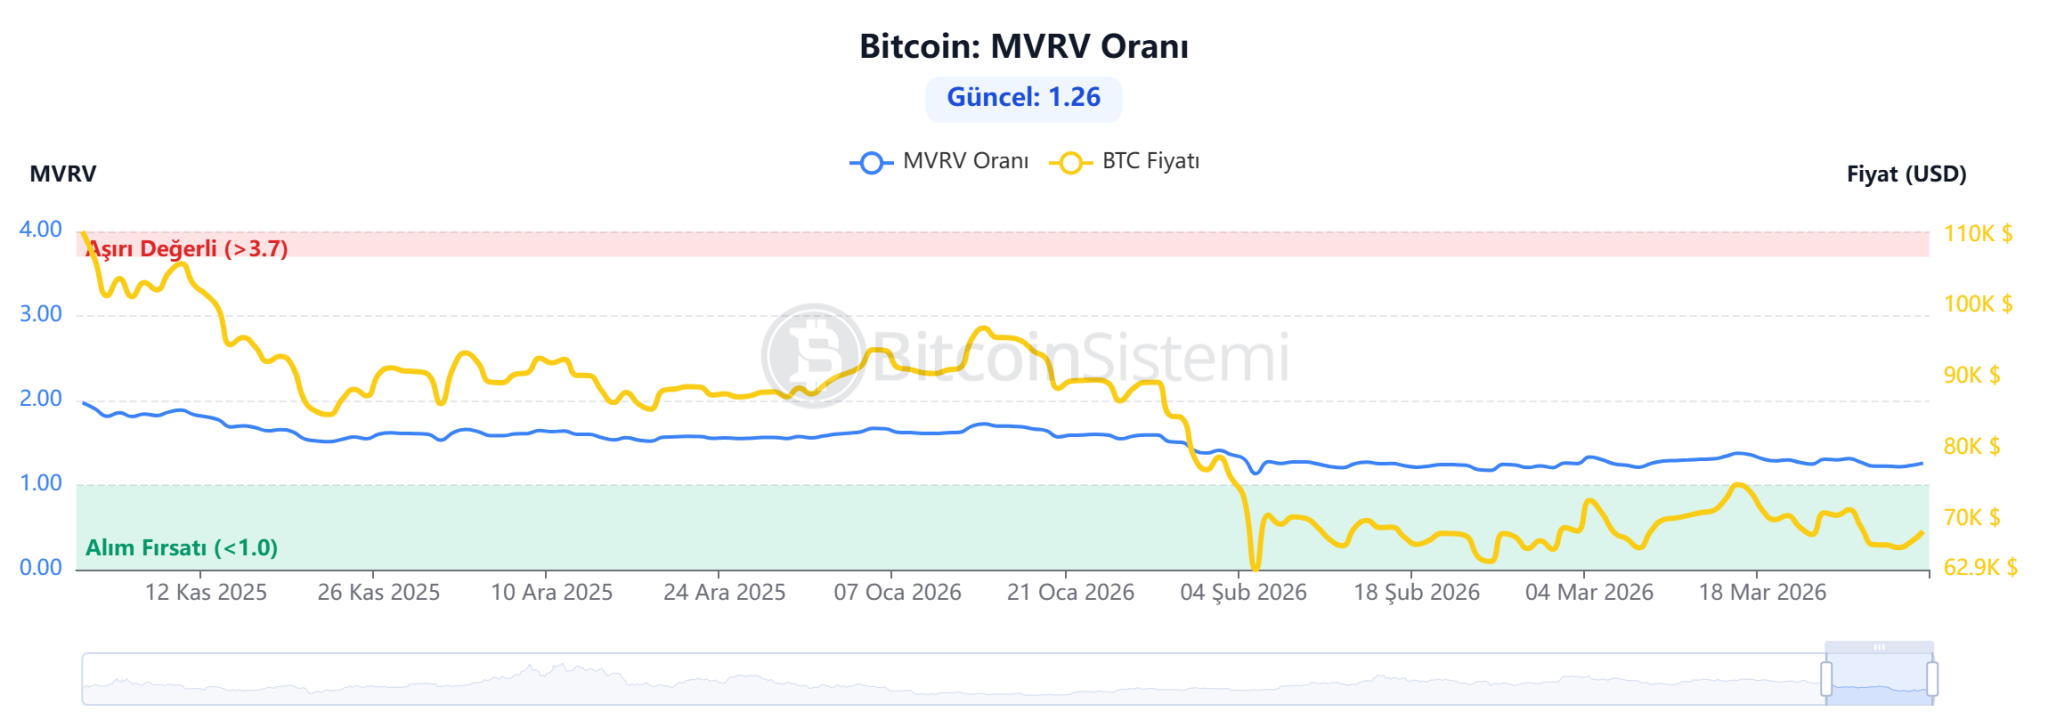
However, the MVRV ratio, another important indicator that suggests the market is not overheated from a valuation perspective, is measured at 1.26. This value makes it clear that Bitcoin is neither overly expensive nor historically cheap, but rather hovers within what can be considered “equilibrium.” According to experts, an MVRV below 1 is considered a strong bottom signal, while levels above 3.7 indicate a market bubble and potential peak risk.
*This is not investment advice.