Bitcoin extended its decline into the macro demand area of $94,000 to $96,000 after failing to retest the broken trendline. The market is currently at a key decision point, and the next reaction from this zone will determine whether the current movement develops into a larger accumulation phase or further correction.
technical analysis
Written by Shayan
daily chart
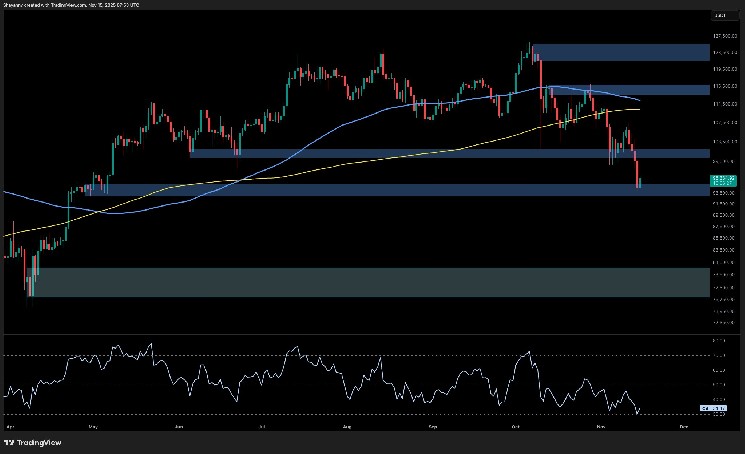
On the daily time frame, BTC is sitting below both the 100-day moving average and the 200-day moving average, each of which is currently positioned as a layered resistance level above the market. The rejection of the 100-day moving average at $110,000 accelerated the decline, ultimately leading to the cleanout of the $99,000-100,000 liquidity cluster.
This is consistent with the strong displacement candlesticks seen earlier this week, indicating a clear advantage for sellers as the market moves into the lower part of the multi-month distribution range.
Testing the current $94,000-$96,000 demand block is important. This region is consistent with previous large-scale trading action earlier this year when long-term participants accumulated in large quantities. If prices stabilize here and form higher lows, this zone could once again play the role of a structural base. If the market fails to defend this area, the next major support will be located deeper, near the $80,000 to $82,000 macro range, forming the lower bound of a larger cycle structure.
4 hour chart
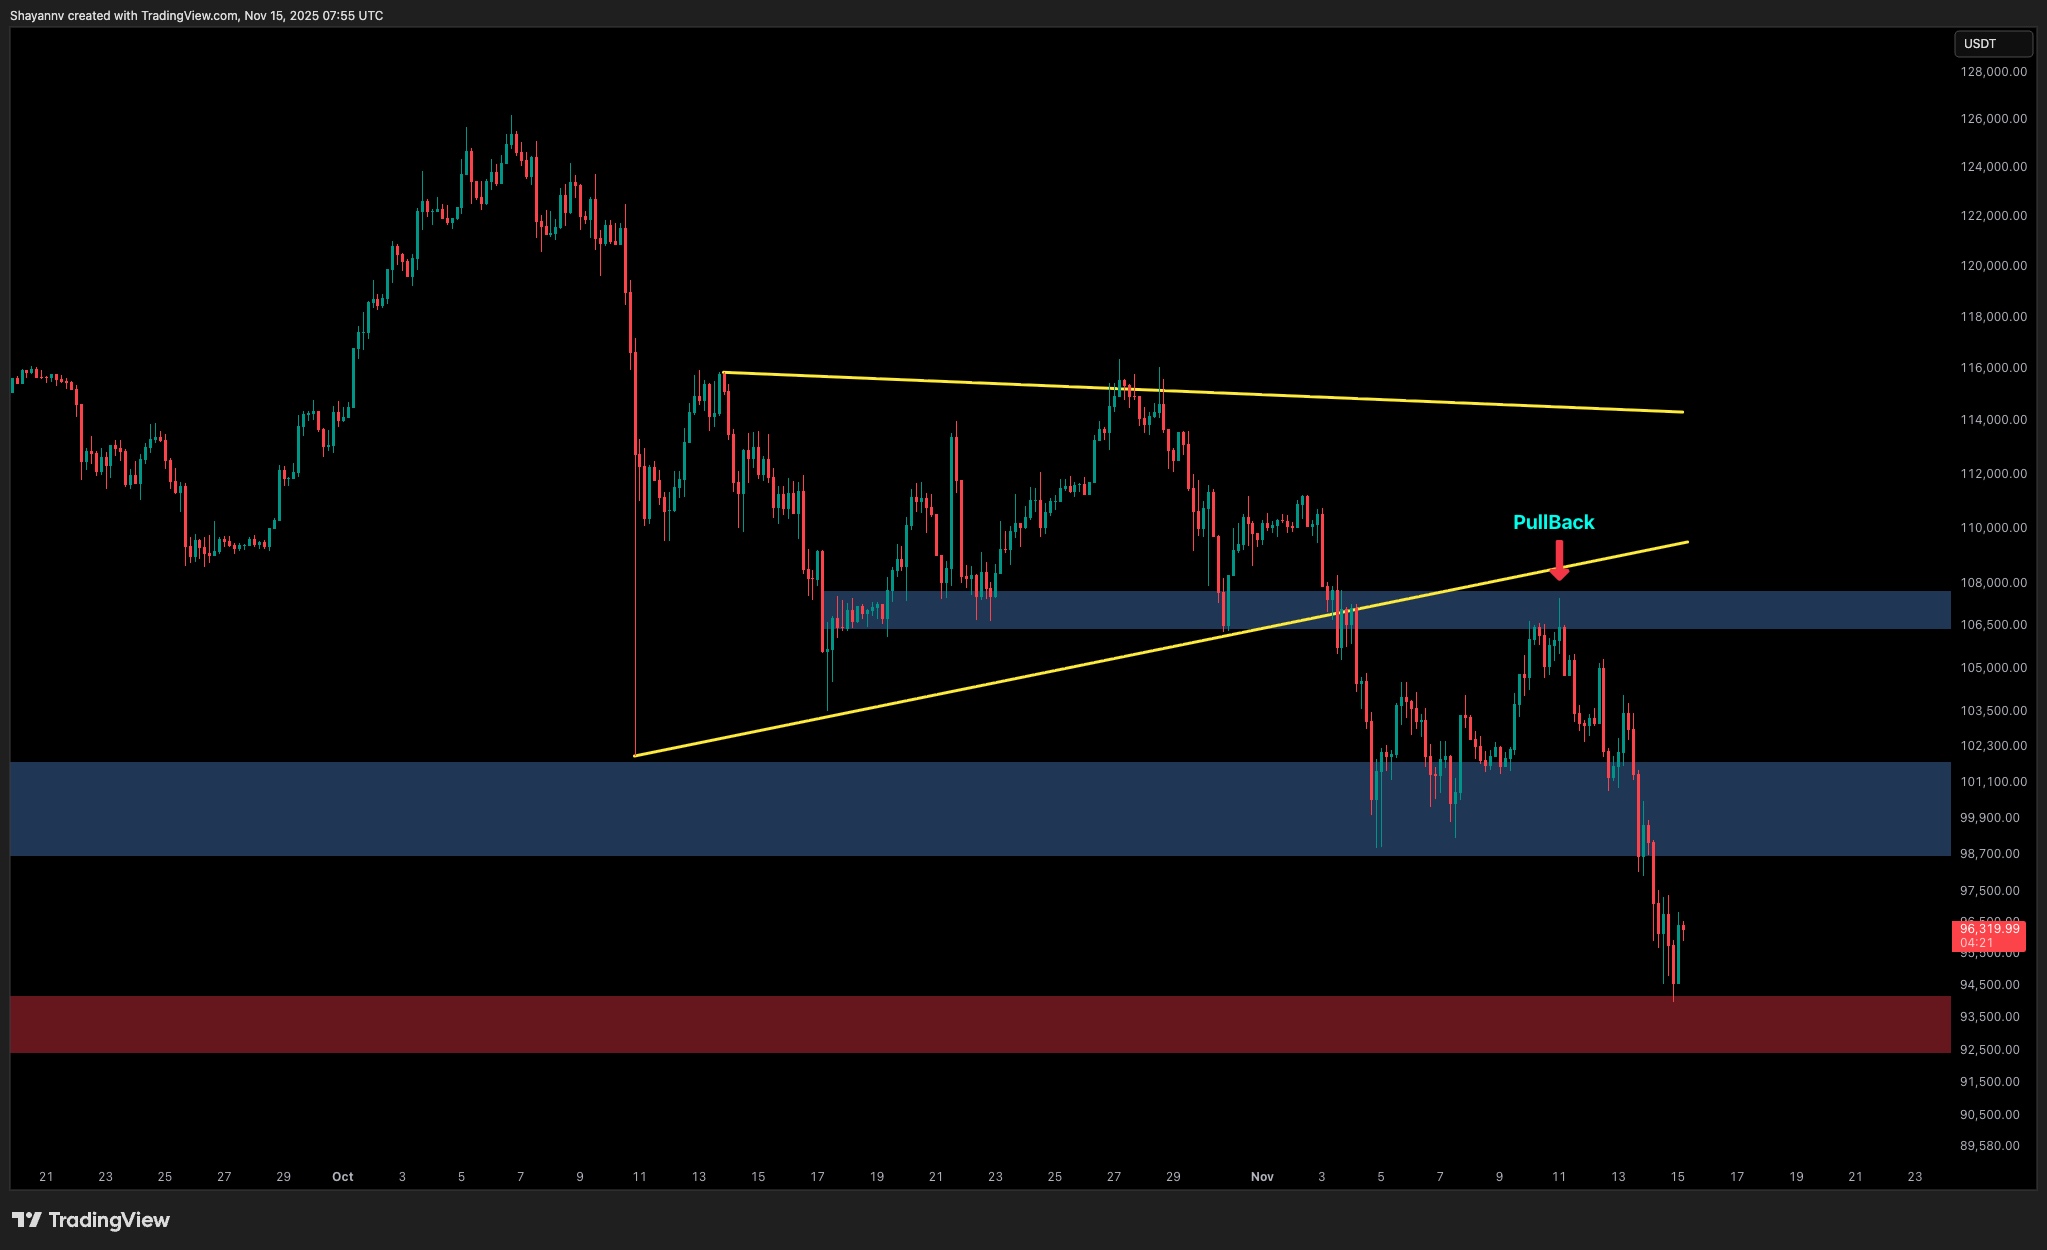
The 4-hour structure highlights how the market completed a complete bearish sequence after the break of the rising wedge. After the break, Bitcoin returned to the lower side of the trend line around $106,000 to $108,000, where a retest was cleanly rejected. This rejection confirmed the transition from support to resistance and decisively changed the short-term trend to the downside.
The subsequent decline sent the price directly into the $94,000-$96,000 zone. This zone is a historically reactionary demand area that has repeatedly initiated medium-term reversals in past cycles. Although an initial reaction is forming here, the structure remains heavy and the asset has not yet generated the signals in the higher timeframes needed to confirm a sustainable recovery.
To exhibit near-term strength, the market must first regain a liquidity pocket of $101,000 to $103,000. This pocket of liquidity is now acting as the closest barrier to continued upside.
On-chain analysis
Written by Shayan
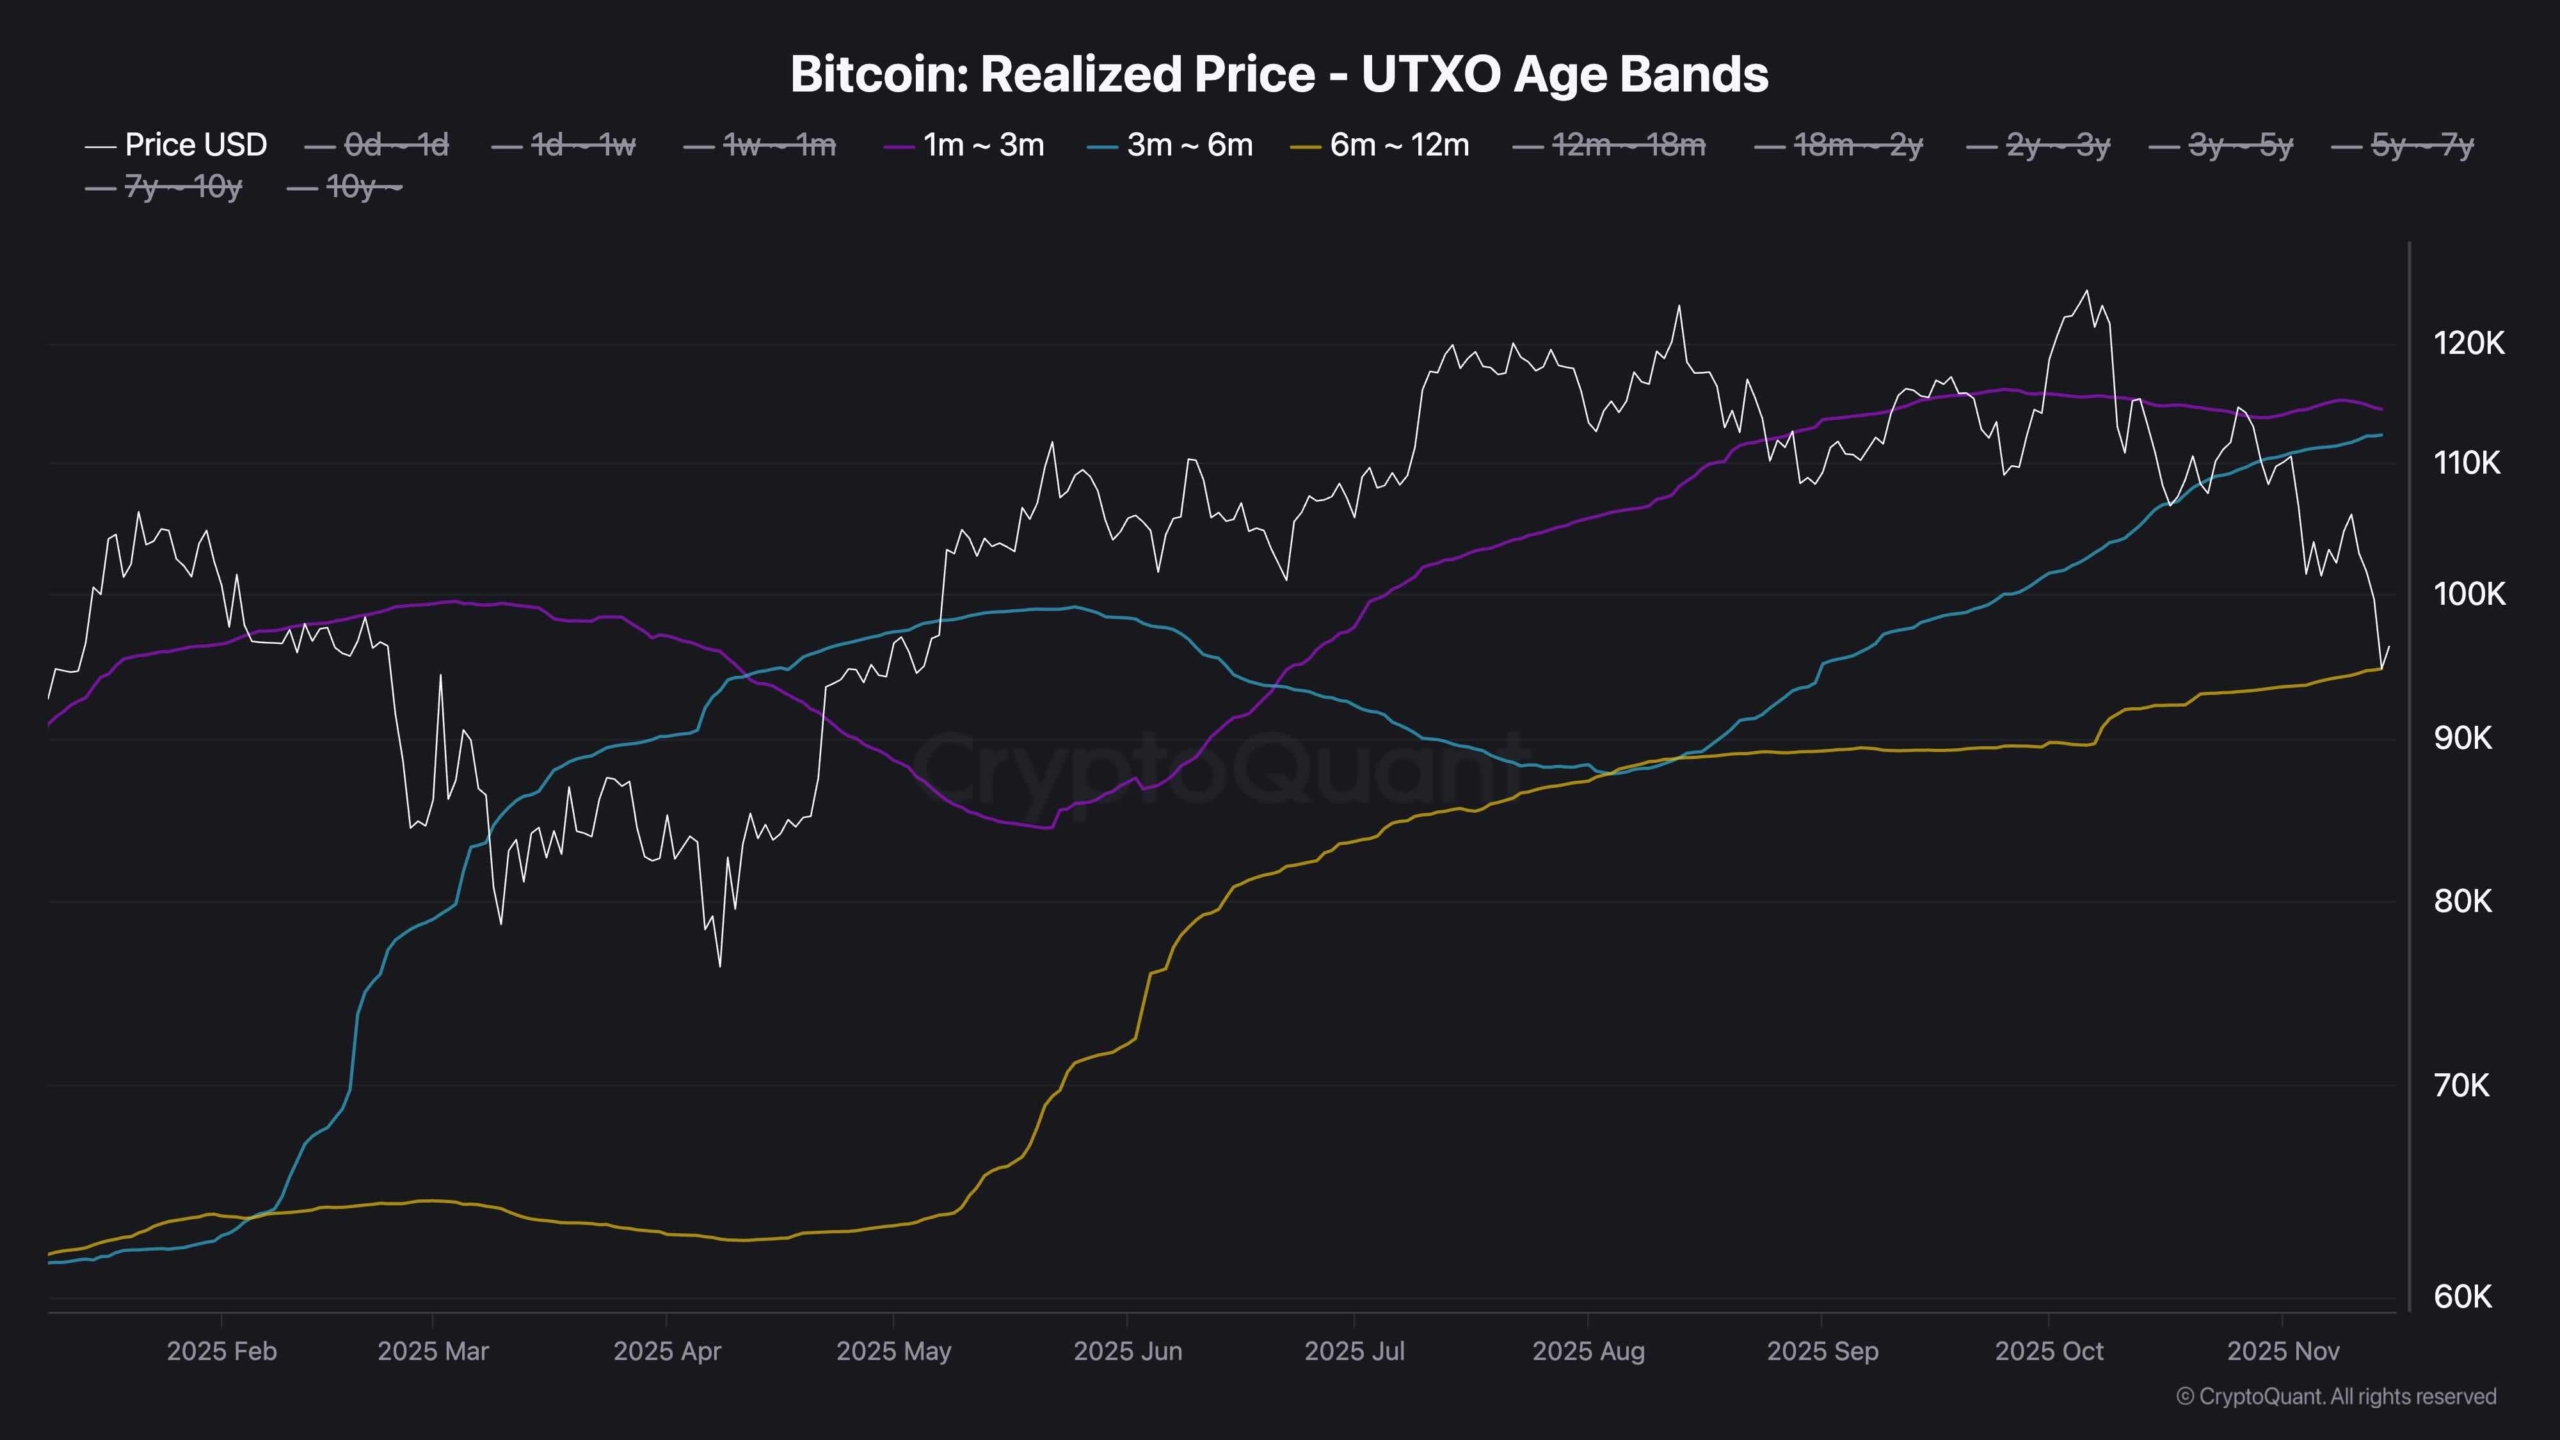
The distribution of UTXO’s realized prices across age groups provides a clear indication of current investor positioning. Bitcoin is currently below the realized price of both the 1-3 month cohort and the 3-6 month cohort. Since these two groups are in total loss, the realized price level has effectively changed to realized supply. This creates an overhead band of approximately $105,000 to $110,000, making short-term holders likely to sell on any recovery attempt to exit at breakeven. Historically, this behavior acts as the first layer of resistance after a sharp decline.
In contrast, the 6-12 month cohort remains profitable, with realized prices around $94,000-$96,000, almost perfectly aligned with current market support. This group is typically more resilient, and realized prices often act as a stabilization zone during deep corrections. In previous cycles, it has been common for the market to interact with the realized prices of this cohort during late-stage shakeouts, allowing long-term participants to absorb supply from surrendered short-term holders.
The resulting on-chain structure positions Bitcoin between real supply from short-term loss holders above and realized demand from medium-term holders below. However, a decisive break below would likely signal a deeper capitulation phase and force a sentiment reset before testing a new bullish leg.