
Many analysts are closely monitoring the 65-month liquidity cycle as risk assets enter a sensitive phase. The model is believed to have accurately predicted market peaks and troughs for over 20 years.
Are we approaching a new tightening phase where silver emerges as an alternative haven while Bitcoin faces 20% downward pressure?
65-month liquidity cycle: global liquidity map enters final stage
In CrossBorder Capital’s latest chart, the black line represents the Global Liquidity Index (GLI). It is currently rising rapidly and is approaching the red peak. The movement is similar to the later part of the 2016-2021 cycle. This strongly suggests that we are entering an active late stage of the liquidity cycle. During this period, the valuation of assets has increased far beyond their original value.

65 month liquidity cycle. Source: X
This is an average cycle of 5.5 years and was first identified by Fourier analysis in 1999. Each cycle follows a familiar pattern. Capital is injected strongly early on, peaking when monetary policy becomes extremely accommodative, and then reversing as credit and liquidity tighten.
Based on the slope of the cycle so far, we expect the next liquidity peak to occur in the first or second quarter of 2026, just a few months later, approximately between March and June. This suggests that we are approaching the “overheat” stage, where capital flows are slowing and correction risks are increasing.
If this assumption holds true, risk assets ranging from tech stocks to cryptocurrencies will soon enter a period of “repricing.” This is the time when smart money starts reducing exposure to highly leveraged positions, potentially leading to a 15-20% correction in Bitcoin before a new cycle bottom forms.
The charts and overall analysis are convincing, but as one of X’s analysts points out, the timing of the cycles on the charts is often off by several years. This means we cannot know for sure whether the market has peaked, will accelerate in the future, remain flat, or do nothing.
“While we like this chart and overall analysis, the timing of the cycle is off by an average of several years on this chart, which means we can’t tell from the chart whether it has peaked, will accelerate going forward, or whether nothing will happen. This is a coin flip,” the analyst noted.
Bitcoin falls, silver rises: signals for safe money rotation
An interesting trend for 2025 is the divergence between Bitcoin (BTC) and silver. According to the 2021-2025 chart, Bitcoin has fallen by about 15-20% from $109,000 to $82,000. At the same time, silver rose 13% from $29 to $33. This reflects a clear change in capital flows. As global liquidity tightens, investors are gradually exiting high-risk assets such as cryptocurrencies and turning to “collateralized” assets such as precious metals.
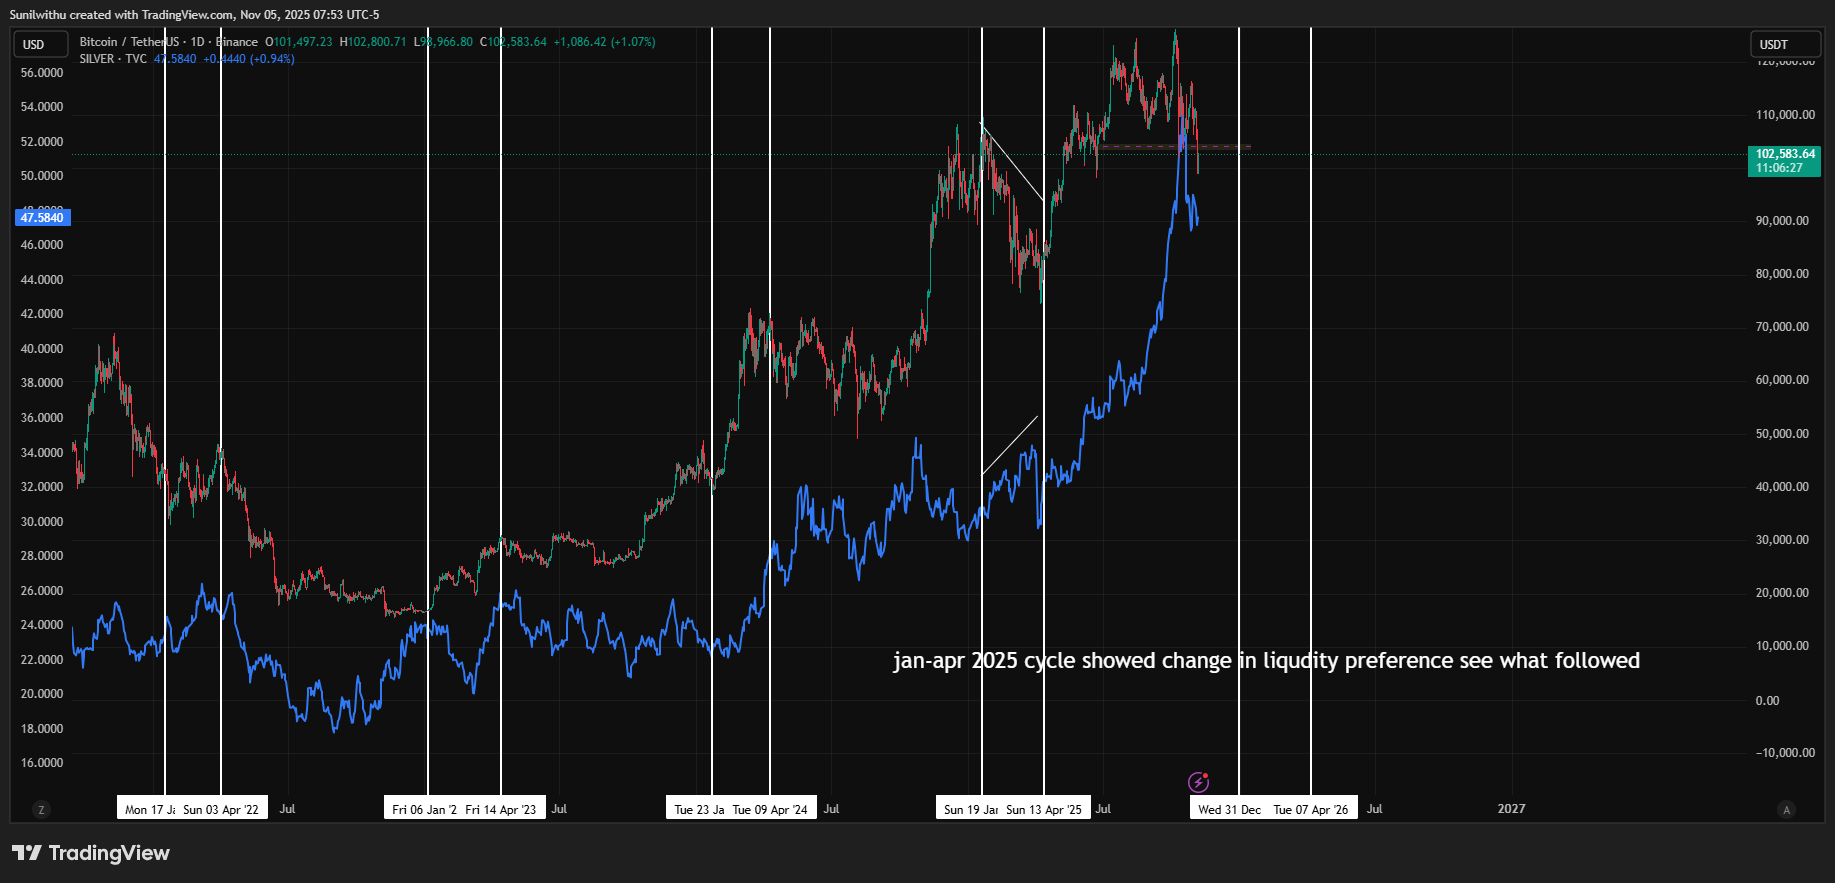
Differences between Bitcoin and Silver. Source:X
This divergence suggests that Bitcoin is acting as a risk-on indicator and directly benefits from increased liquidity. At the same time, silver’s dual characteristics as both a commodity and a safe-haven asset make it even more attractive in times of high inflation but slowing economic growth.
Based on stagflation signals and historical trends in liquidity cycles, many experts predict that silver could outperform Bitcoin from January to April 2026. However, the rally in both assets at the end of 2025 suggests that this change will not occur suddenly, but will be tempered by market sentiment and macro events.
“This trend may accelerate from January to April 2026. Bitcoin may only recover modestly, but silver will soar and the rotation into tangible collateral will deepen,” the analyst said.
2026: A critical year in the cycle – will Bitcoin rebound or will silver continue to lead?
A 20% drop in Bitcoin sounds bearish, but it does not necessarily signal the end of a bullish cycle. At the end of a liquidity cycle, markets typically experience a sharp correction before entering a final upward phase known as a “liquidity echo rally.” If this scenario repeats, Bitcoin could experience a technical decline before rebounding significantly in late 2026.
Silver, on the other hand, could sustain short-term gains as it benefits from industrial demand and hedging flows. However, if global liquidity expands again in 2027, speculative funds may move away from precious metals and into cryptocurrencies and stocks in search of higher returns.
In summary, the 65-month liquidity cycle is entering a critical phase. While Bitcoin is likely to experience a temporary correction, silver continues to play a “stabilizing role” in the market. For long-term investors, this may not be an exit signal, but rather an opportunity to reposition their portfolios ahead of the next wave of liquidity in 2026-2027.
This article “The 65-month clock is ticking: Why Bitcoin is down 20% while silver shines” was first published on BeInCrypto.