Ethereum is showing early signs of recovery with a $25 million short liquidation, indicating that bullish momentum may be building.
Ethereum (ETH) is attempting a gradual rebound following recent downward pressure, with the price hovering around $2,912.14 at the time of writing, up about 1.6% in the past 24 hours. The intraday range from $2,862.84 to $2,973.89 shows that buyers are repeatedly testing the upper band but are still struggling to regain the psychological level of $3,000.
But when you zoom out, the picture remains cautious. Ethereum is still down about 5.5% over the past week, 16% over the past 14 days, and over 30% over the past 30 days. With this background in mind, we will discuss it in detail in the next section. Ethereum major technical levelsthe trend structure, and the catalysts that may determine whether this pullback develops into a more meaningful recovery.
Next resistance in Ethereum price
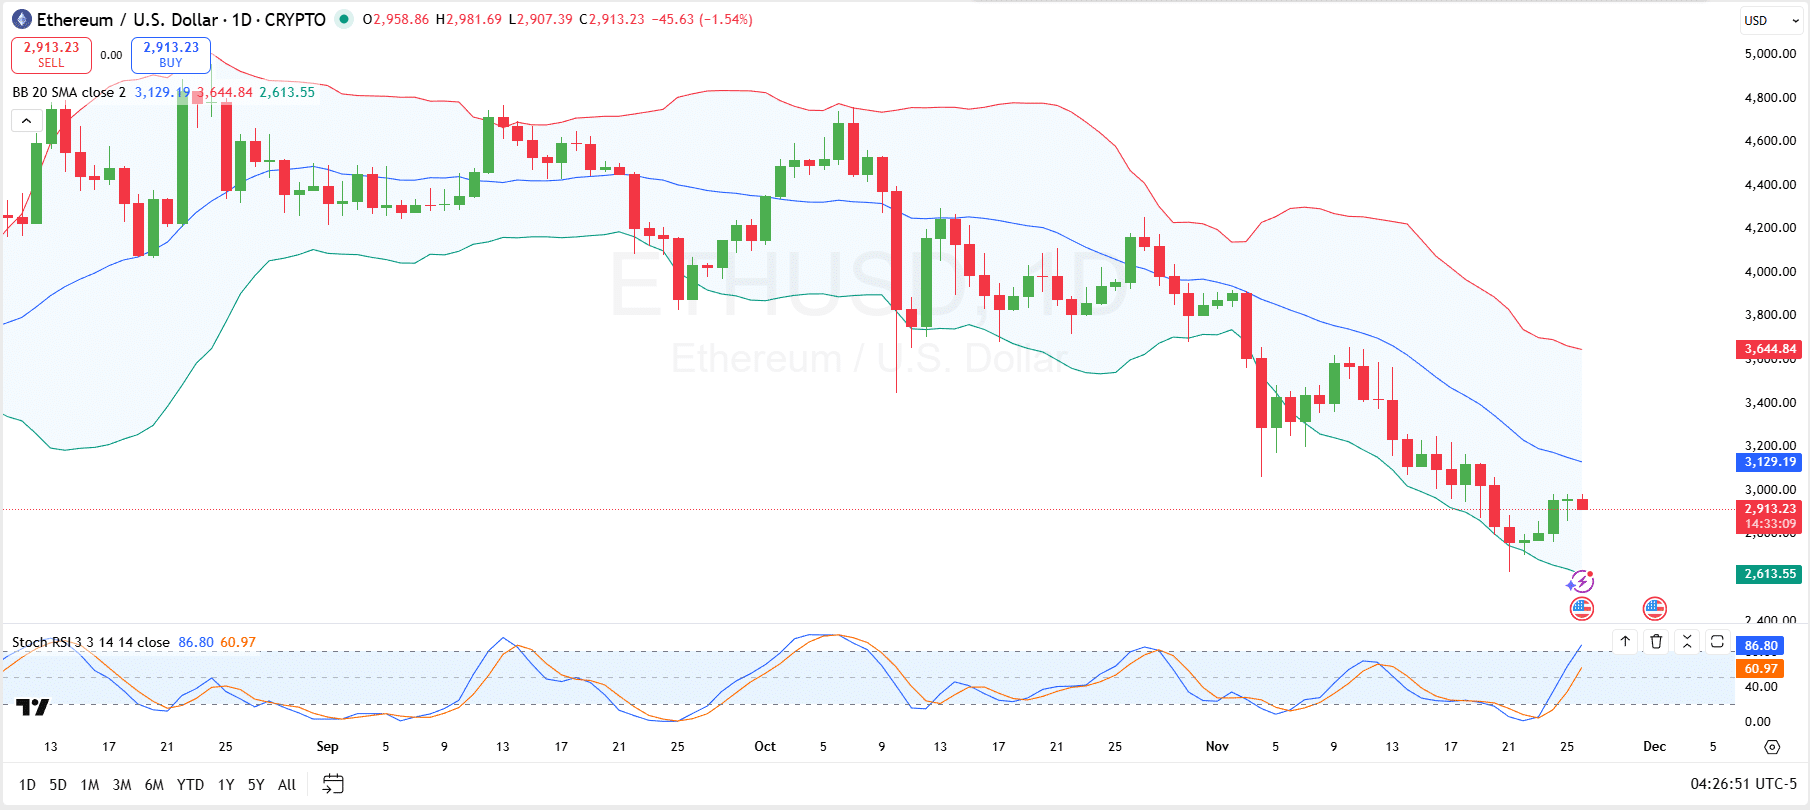
Specifically, on the technical side, Ethereum’s daily chart built around the Bollinger Bands shows that the token is trying to recover from sustained downside pressure. On November 21st, the price rose through the lower band around $2,629, suggesting an oversold situation, before rebounding within the band and rallying towards the midline, currently near $3,129.

Ethereum
This reversal move suggests that sellers are losing some control, but the band is still trending down, highlighting that the broader trend is still corrective. A clean daily close above the middle band would be an important first step to reduce volatility, shift momentum back in buyers’ favor, and open room for the upper band around $3,644. This move would require Ethereum to rise approximately 25% from its current $2,912.
Interestingly, momentum signals from the stochastic RSI support this early recovery story. After spending time in the oversold zone, the Stoch RSI line has risen sharply, with the blue line currently at 86.8 and the signal line continuing at 60.97, reflecting a strong swing in short-term bullish momentum. However, readings at or near overbought territory also warn that the upside could cool if Ethereum fails to clear nearby resistance.
Ethereum clearing data
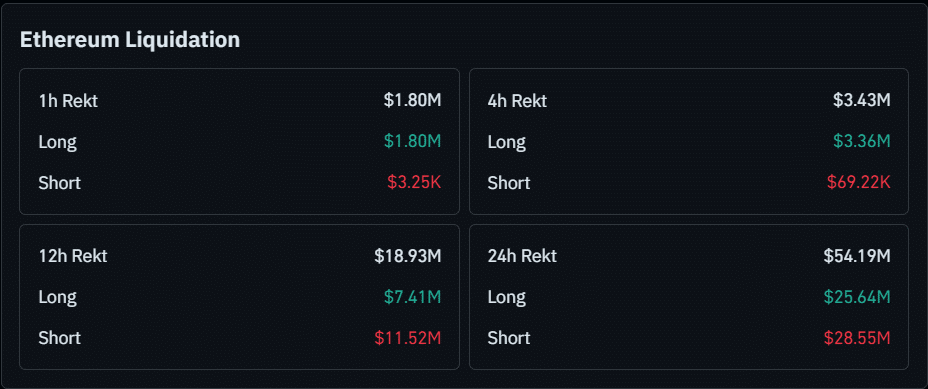
Technical image backup, derivatives data This shows that Ethereum is in the midst of a leverage reset as both bulls and bears are “correcting” on different time frames. In the past hour, approximately $1.8 million of positions were liquidated, almost all of them long, with only about $3,000 of short positions liquidated.

coin glass
A similar story can be seen on the 4-hour time frame, where out of the total liquidation of $3.43 million, long positions account for the majority of around $3.36 million, while short positions account for only $69,000.
However, the balance changes when you zoom out. In the past 12 hours, Ethereum liquidations amounted to $18.93 million, with longs of about $7.41 million and shorts of $11.52 million, but the 24-hour tally increased to $54.19 million with longs of $25.64 million and shorts of $28.55 million. Notably, the shorts are currently taking most of the losses, indicating that the market is tilted to the upside.


