
The demand structure for Bitcoin deteriorated sharply towards the second half of 2026. The combined growth rate of spot futures demand and perpetual futures demand declined towards -650,000. $BTCSince 2019, this level has only been reached three times.
This is important because the weakness extends beyond leveraged traders to organic market demand.
Historically, similar contractions preceded periods of great instability.
First, demand collapsed before the crash in March 2020. Then we saw a similar deterioration in the 2022 bear market. In both cases, extreme measurements indicated structural exhaustion rather than immediate recovery.
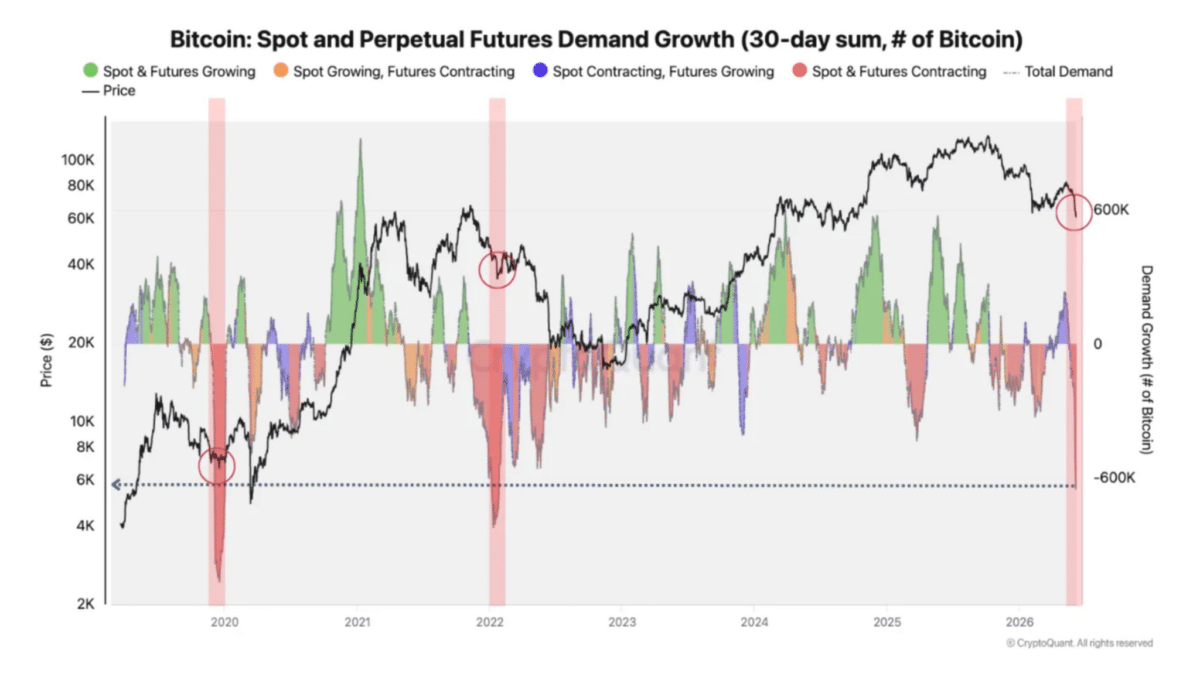
Bitcoin is now facing a similar challenge. While fewer spot buyers are entering the market, derivatives exposure continues to shrink. As a result, the market is less able to absorb new selling pressure.
However, this does not automatically mean another sharp decline. Rather, history suggests that volatility may increase first. After that, Bitcoin could enter a long-term phase where momentum is weak and participation is constrained.
Until demand begins to recover from these extreme levels, price trends are likely to remain fragile despite approaching long-term value zones.
CVDD ratio rises towards cycle bottom
Bitcoin’s weakening demand profile continues to weigh on prices.
But metrics are starting to offer a different perspective.
The (Cumulative Value to Days of Destruction) CVDD to Price ratio has risen to 0.73, close to the historical cycle bottom near 0.85.
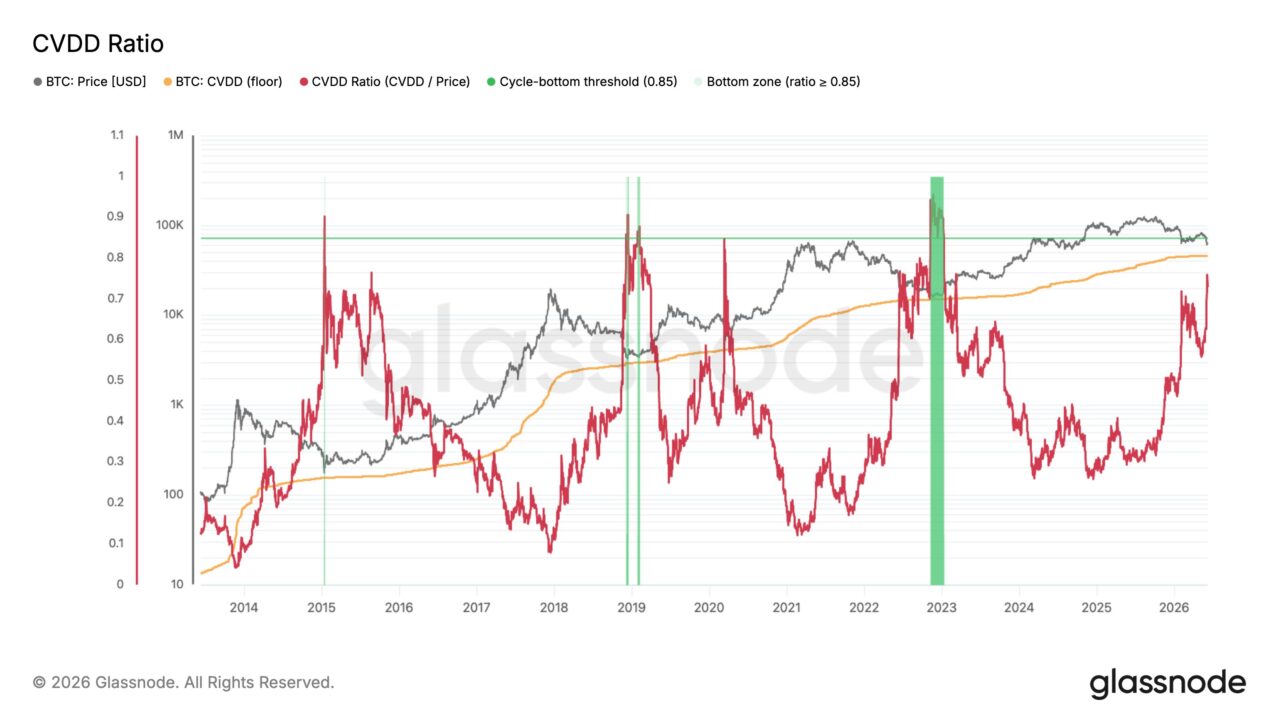
This is important because past bear markets followed a similar path. In 2015, 2018, and 2022, this ratio approached the bottom zone level as prices converged toward the CVDD floor.
As of June 9, that floor was sitting at nearly $46,000.
Historical predictions place the potential bottom zone between $52,000 and $59,000. Therefore, while Bitcoin appears to be moving closer to long-term value territory, a recovery in demand remains essential for a sustained bottom to form.
Liquidity dries up across the virtual currency market
Bitcoin’s approach to historical value zones reflects weakening demand behind the scenes. Now, broader liquidity indicators are reinforcing that signal. Last week, crypto ETFs recorded more than $1.8 billion in net outflows, with Bitcoin accounting for the majority of withdrawals.
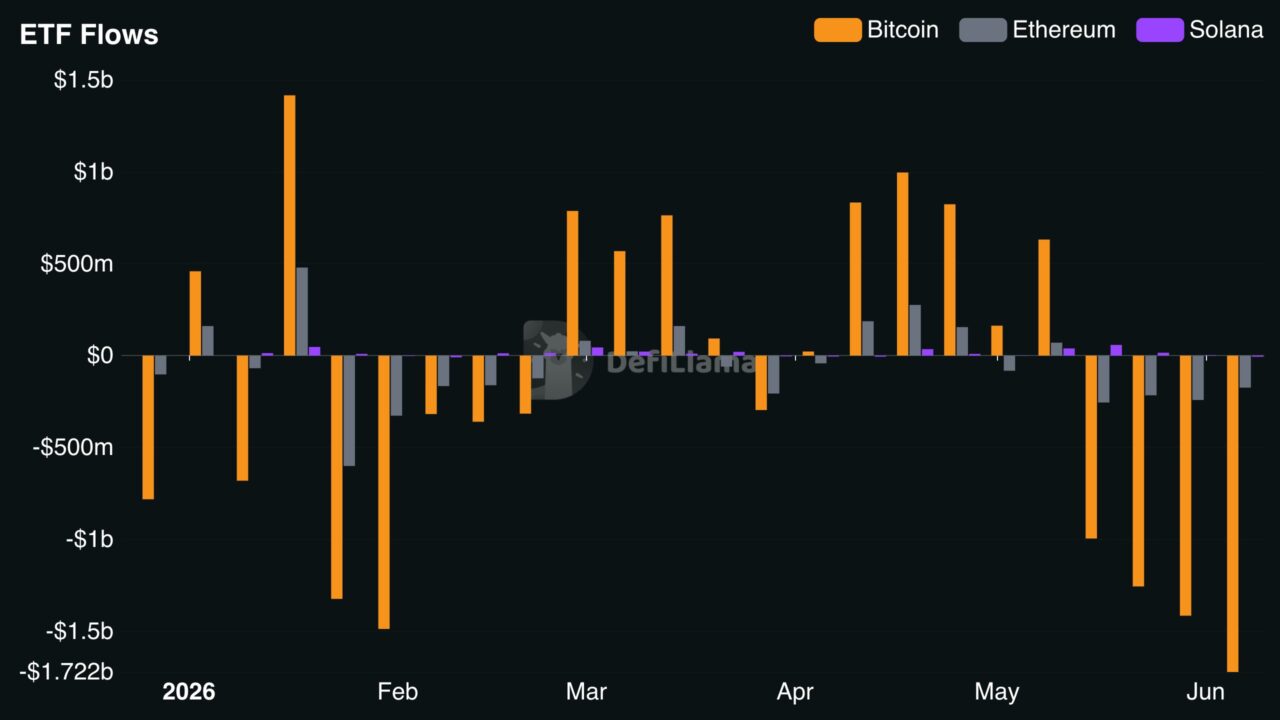
The latest reading approached $1.7 billion, highlighting a rapid change in the institution’s position.
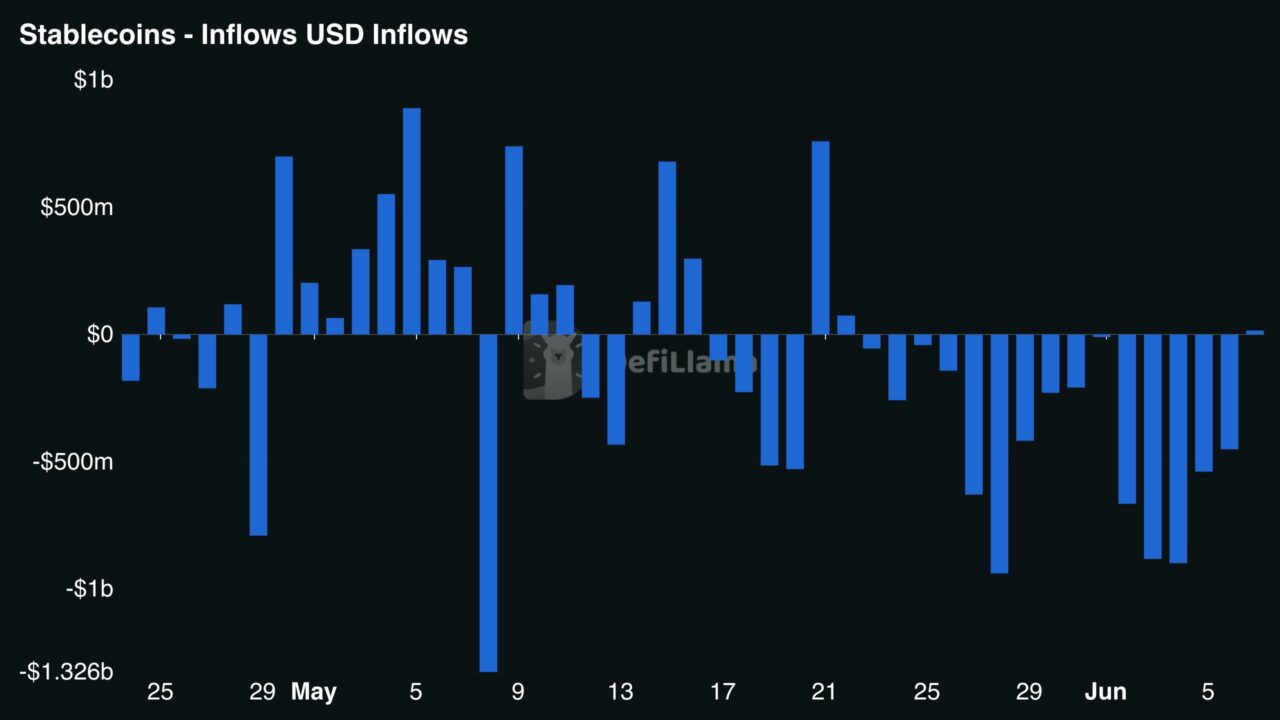
The pressure spreads further. Stablecoin supply decreased by more than $3 billion, continuing the negative trend that emerged in late May. Taken together, these flows suggest that capital is flowing out rather than circulating within the crypto market.
Unless liquidity conditions improve, risk appetite is likely to remain weak despite increasingly attractive valuations.
Final summary
- Bitcoin ($BTC) is approaching historic value zones, but weak demand and liquidity continue to delay bottom confirmation.
- Bitcoin remains vulnerable to volatility as ETF outflows and stablecoin shrinkage weigh on recovery prospects.