
Just yesterday, CoinDesk reported that despite lingering war risks, analysts expect Bitcoin to rise above $88,000 on the back of several crypto-specific factors, including bullish market trends.
But now, about 16 hours later, the price chart says “not so fast.”
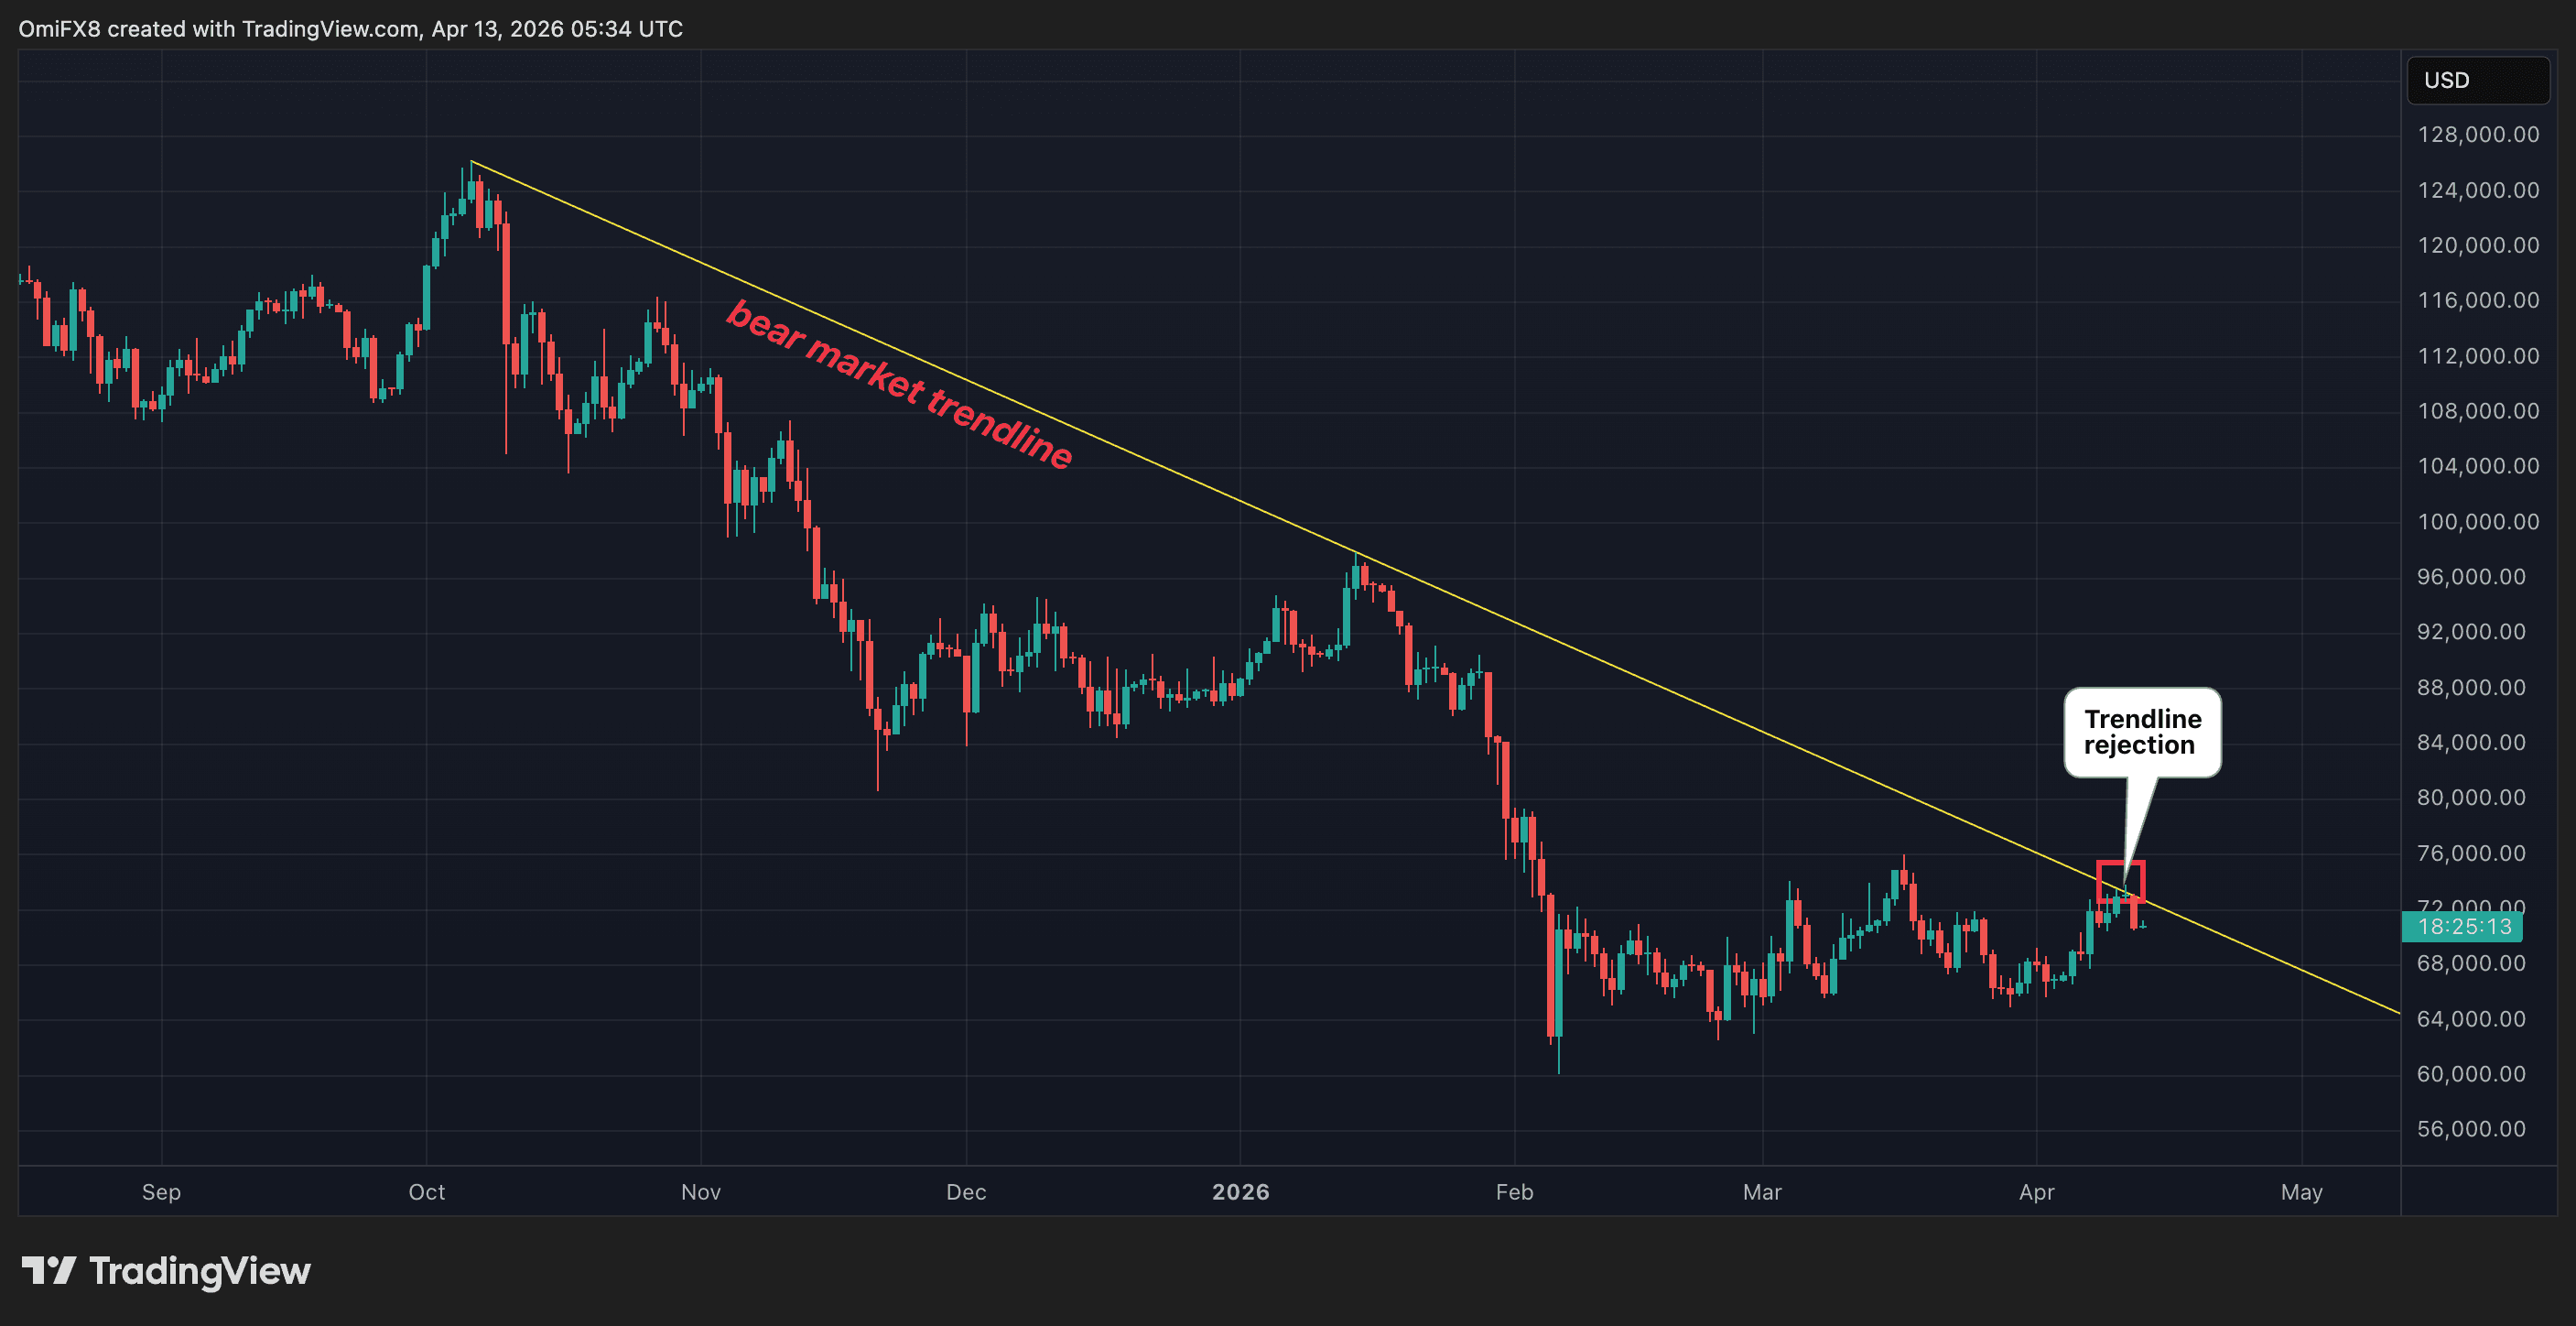
Bitcoin price ran directly into one of the most important technical levels, the downtrend line that has been in place since October, when Bitcoin peaked above $126,000. And at that very moment, the price fell from the trendline resistance.
What is a downtrend line? Why is it important?
A downtrend line is drawn by connecting a series of price peaks that become progressively lower over time. Consider the case of dropping a ball from a great height. When the ball bounces, each rebound is lower than the last. Now imagine connecting these low prices with a straight line. This is a downtrend line, capturing the fading strength behind each pullback.
In the market, this reflects a decline in purchasing power, with sellers increasingly asserting control over price action. The longer the trend line is held and the more often the price falls from the trend line, the more important the trend line becomes and indicates continued bearish conditions.
In the case of Bitcoin, this particular trendline has been sloping downward since its peak of $126,000 in October 2025. This is about 6 months of low highs and 6 months of the market indicating that the trend is down.
This is what traders call the textbook bear market trend line.
rejection
Since early February, Bitcoin has risen from nearly $60,000 to more than $71,000. That sounds bullish on the surface, and in isolation it really is. However, if we zoom out, we can quickly see that this is a rebound rally within a broader downtrend represented by the downtrend line.
This trend line was tested overnight and prices have since turned downward. This is what technical analysis enthusiasts call a trendline rejection, meaning that sellers overwhelmed buyers exactly where the bear market trendline predicted.
The market looked for resistance, found it and pulled back. Until then $BTC can be closed On top of that This trend line is not only crossed during the day, but is on meaningful volume, and this line remains under control, leaving the broader downtrend intact.
Fundamentals tell us what should happen, but analysts on Sunday cited several fundamental data sets, including Coinbase Premium ETF inflows and macros, as catalysts for the rally to $88,000.
However, the price chart shows what is going on, and now a textbook rejection at the 6-month bear market trend line is showing bulls’ caution.
What to see from here
The trend line is an important variable, based on which two scenarios can develop.
First, the recent rejection at the trendline will lead to stronger selling pressure and further decline to $65,000.
The second scenario includes $BTC It will rise and break through the trend line. That would be an important positive development and the chart would start to align with the bullish fundamental story.
The chart and bull case tell two different stories until the second scenario plays out.