
The Fed kept interest rates unchanged on June 17, but Bitcoin still felt the policy outlook was tightening underneath.
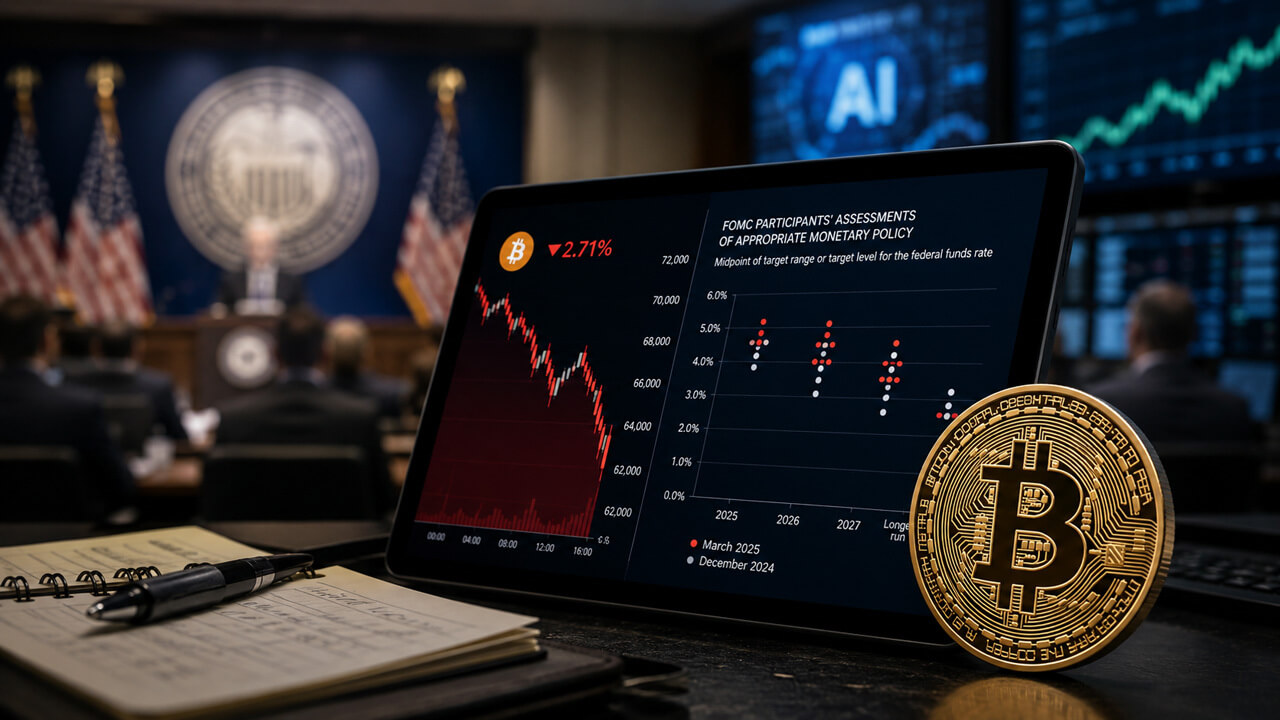
The FOMC voted to keep the target range at 3.50% to 3.75%, but of the 18 dotplot forecasts submitted, nine suggest at least one rate hike by year-end, eight remain unchanged at the current midpoint, and only one still supports a cut.
Bitcoin fell about 2%, hitting an intraday low of $63,950 to trade around $64,300, staying within its recent range as traders absorbed the policy outlook that has shifted from lower interest rates to higher rates in three months.
Warning hold
The June 17 FOMC meeting was Kevin Warsh’s first as committee chairman, but he chose not to submit any personal comments, leaving his published forecast at 18, one less than the usual full count.
Interest rate markets quickly moved with the change in tone, with traders estimating a 72% chance of a rate hike through October, but when the dots intersect, the chance of a rate hike in December jumps to about 78%, according to CME data tracked by MarketWatch.
Three months ago, the unanswered question on trading desks was how quickly the Fed would cut rates, but the latest outlook has reversed that question.
Bitcoin’s decline coincided with a broader risk-off movement across all major asset classes. The Dow fell 1.01%, the S&P 500 fell 1.28% and the Nasdaq fell 1.45%, while the 10-year Treasury yield rose to 4.467% and the dollar strengthened.
That afternoon, SPY was down about 1.2% and QQQ was down about 1% as stocks, bonds, and cryptocurrencies all revalued reflecting the same hawkish signal.
| market signals | Latest movements/readings | why is it important |
|---|---|---|
| Fed target range | 3.50% to 3.75%, no change | The Fed did not raise rates, but its policy outlook tightened. |
| dot plot | 9 of 18 forecasts suggest at least one rate hike | The committee is divided, indicating that the risk of rate hikes is once again on the table. |
| October rate hike odds | ~72% | Traders moved quickly to price in near-term rate hike scenarios. |
| December interest rate hike odds | ~78% | The market currently sees year-end interest rate hikes as a likely path. |
| Bitcoin | Down about 2%, around $64,300. | BTC traded like a high-beta risk asset. |
| S&P500 | ~1.28% decrease | This move is not specific to cryptocurrencies, but confirms a broader risk-off. |
| Nasdaq | ~1.45% decrease | Growth and high-beta assets were hit even harder. |
| 10 year government bond yield | 4.467% | Financial conditions have tightened due to rising yields. |
| dollar | strengthened | Pressure has increased on risk assets, including Bitcoin. |
Why does the hold still have weight?
Matt Mena, senior crypto research strategist at 21Shares, said the no-change vote was a formality over the actual signals noted in the memo.
The dot in the middle now points to a potential rate hike later this year, a sharp reversal from the rate cuts that markets were still writing in three months ago as inflation remains at a three-year high as a surge in energy prices due to the Iran conflict affects prices.
Mena pointed to the Bank of Japan raising its policy rate to 1% a day earlier as an added boost, rekindling concerns about an unwinding of the yen carry trade that has quietly supported risk assets for months.
He also noted Warsh’s distinct profile in the digital asset market as the first Fed chair with personal ties to cryptocurrencies, including early investments in multiple projects, and the public’s goodwill for Bitcoin, which breaks with the tone of his predecessor.
The roughly 2% drop during the meeting kept Bitcoin within the $64,000-$65,000 zone, making it the market’s immediate line of defense.
Mena sees $70,000 as the level Bitcoin needs to clear with confidence before retesting $75,000 and running at $80,000. This is the same sequence the asset followed in May, with a third-quarter target near $100,000, at the far end of its bullish trajectory.
| level | role | what does it inform |
|---|---|---|
| $60,000 | Low range/stress zone | A re-examination would suggest that the Fed shock overwhelmed the post-ceasefire rebound. |
| $64,000 – $65,000 | immediate defense zone | The retention here supports the “fragile stabilization” theory. |
| $68,000 | negative gamma cluster | Price movements here could become more volatile as dealer hedging tightens. |
| $70,000 | breakout trigger | A break above this level will reopen the door to $75,000-$80,000. |
| $72,600 | short-term holder cost basis | Recent buyers are approaching break-even above this area. |
| $77,200 | Glassnode true market average | A structural boundary separating bearish conditions from pre-bullish territory. |
| $80,000 | bullish momentum target | A stronger recovery is confirmed when reached after collecting $70,000. |
| $100,000 | Bull case target for 3rd quarter | This is not a basic scenario, but an aggressive upside scenario. |
Gerry O’Shea, Head of Global Market Insights at Hashdex, offered a more subdued view of the same data.
He expects Bitcoin to continue trading in the $60,000 to $70,000 range in the coming weeks.the absence of a major catalyst names the possibility of passage of the CLARITY Act or further escalation of the US-Iran conflict as follows. A development that could potentially break the range.
In his view, sentiment remained depressed as high-profile IPOs and AI stocks took attention away from cryptocurrencies, but he expects capital to rebound as institutional investor interest expands and regulations around stablecoins and tokenization become clearer.
What on-chain data adds
Glassnode’s latest weekly report shows most clearly why analysts aren’t calling this a clean breakout setup either.
Bitcoin is trading about 15% below its true market average, currently near $77,200, a gap that Glassnode treats as the clearest signal separating a structurally bullish regime from a structurally bearish regime.
The report clearly states that the spot price is close to $65,600 against that threshold, and despite the recent pullback, the on-chain regime remains firmly on the bearish side of that line.
MVRV for short-term holders has rebounded from 0.81 to 0.90 over the past week, but is still below the break-even point of 1.0, and the implied cost basis of the cohort remains near $72,600, with recent buyers about 10% underwater on average.
Therefore, each time a rising market approaches the entry price, a pool of potential sellers remains. Capital flows tell a similar story, with the realized cap shrinking by 1.45% over the past 90 days to $1.7 trillion, but the seven-day change is nearly flat at -0.18%, stalling after a steady decline in the previous week.
Below these still bearish thresholds, market microstructure appears to be healthier than in recent weeks.
Glassnode found that the spot order book has been restructured on the bidding side, with reluctant buyers absorbing supply more efficiently than during the drawdown toward $60,000.
Implied volatility has sharply normalized across maturities, option skew has retreated from the extreme levels experienced during the downturn, and volatility risk premiums have turned negative as realized volatility exceeds what the options market is pricing in.
The largest negative gamma cluster is around $68,000, with short-term gamma exposures ranging from $66,000 to $71,000, while positive gamma is much higher, in the low $70,000s.
| Glassnode metrics | Current measurement value | Bullish confirmation needed | interpretation |
|---|---|---|---|
| true market average | ~$77,200 | BTC regains this level | Bitcoin remains structurally below the bull market threshold. |
| Distance from true market average | ~15% or less | The gap narrows or becomes positive | Spot prices have not recovered enough to support a regime change. |
| Short Term Holder MVRV | 0.90 | 1.0 or higher | Modern buyers are still underwater. |
| STH cost base | ~$72,600 | BTC will trade above that | Regaining this level will reduce overhead supply from recent buyers. |
| realized cap | $1.07 trillion | 90-day growth rate turns positive | Capital is still shrinking, but at a slower pace. |
| 90-day realization limit change | -1.45% | positive trend | Check to see if new capital is coming back. |
| 7-day realized limit change | -0.18% | become stable or positive | This suggests that capital outflows are slowing down. |
| spot liquidity | improve | Bid depth continues to rebuild | Passive buyers absorb supply more efficiently. |
| Optional skew | Normalization | Protection demand remains subdued | Mandatory bearish hedging pressures are easing. |
There are two paths from here
The bullish path would see Bitcoin retest $75,000 and clear $70,000 with enough confidence to challenge $80,000, the same move that Mena warned about in the May pattern.
This type of advance would also begin with short-term holders’ MVRV pushing back above 1.0 and the realized cap turning positive on a 90-day basis, ultimately testing the true market average of $77,200, which currently separates bearish and bullish territory.
Mr O’Shea said further easing of tensions in Iran could provide a catalyst, mitigating the possibility of rate hikes, which is currently lacking.
On a more cautious path, Bitcoin would stay within the $60,000 to $70,000 range described by O’Shea, but the Fed’s hawkishness and Treasury yields near 4.5% would limit any upside before reaching the $68,000 gamma cluster, which is already attracting dealer hedging activity.
Along this path, short-term holders remain underwater, the Realized Cap continues to shrink even as the pace slows, and money that might otherwise flow into Bitcoin continues to chase IPOs and AI stocks, which O’Shea points to as the current competition for investor attention.
Bitcoin’s reaction to the Fed appears to be defensive, and Glassnode data shows that repairs are still underway. The asset is trading in the mid-$60,000s as reluctant buyers return, volatility normalizes, and forced selling fades.
Until it regains its recent purchaser cost basis and pushes back towards the true market average of $77,200, a more accurate representation of Bitcoin’s condition is fragile stabilization.
(Tag translation) Bitcoin