
Bitcoin prices continued to face significant headwinds, causing them to crash to the all-important 50-day moving average. spot $BTC While ETF outflows have soared, the Coinbase Premium Index has been in the red for weeks, indicating weaker U.S. demand. $BTC is trading at $76,745, a significant drop from this month’s high of over $82,000.
Bitcoin price falls due to sharp increase in ETF outflows
There are signs that demand for Bitcoin in the US is declining this month. The momentum these funds had at the beginning of the month has largely disappeared today, according to data compiled by SoSoValue.
All Spot Bitcoin ETFs are currently experiencing outflows for the past three consecutive days. It lost $331 million on Tuesday, after losing $648 million the previous month. These funds have collectively outflowed more than $1.2 billion over the past three business days.
Most notably, unless something changes, the company is expected to end the month in the red. This month’s loss is $727 million, which is remarkable considering it added more than $1.6 billion in the first six days of the month.
Coinbase Premium Bitcoin Index Falls
The closely watched Coinbase Premium Bitcoin Index has been in the red for the past few weeks. This is an important number to look at the overall demand for the coin in the US, where Coinbase is the most popular exchange among retail and institutional customers.
Ideally, when demand is strong, the price of Bitcoin on Coinbase will tend to be higher than on other exchanges. Currently, prices remain slightly higher than Binance, the most popular platform internationally.
A similar trend is occurring in the futures market, where open interest has continued to decline over the past few months. This open interest has fallen from over $60 billion a few weeks ago to $55 billion now.
There are several reasons why this happens. First, oil prices have remained high this month, with Brent crude oil and West Texas Intermediate rising above $105. The average price of gasoline in the United States has jumped to $4.50, and this increase is likely to continue for some time.
These numbers mean consumer inflation will continue to rise this year. Headline consumer inflation rose to 3.8% in April, according to a report released last week. The producer price index rose to 6%, the highest level in years. As a result, there are concerns that the Federal Reserve will keep interest rates high for an extended period of time.
Second, there are signs that investors are capitulating and moving to a better-performing stock market where the AI boom is accelerating. In fact, the stock market’s top ETFs like VOO and IVV have added billions of dollars this year.
Third, the bond market remains under pressure, with 30-year bond yields rising to levels above 5%. As such, there are signs that investors will start moving into the bond market in the near future.
$BTC Price prediction: technical analysis
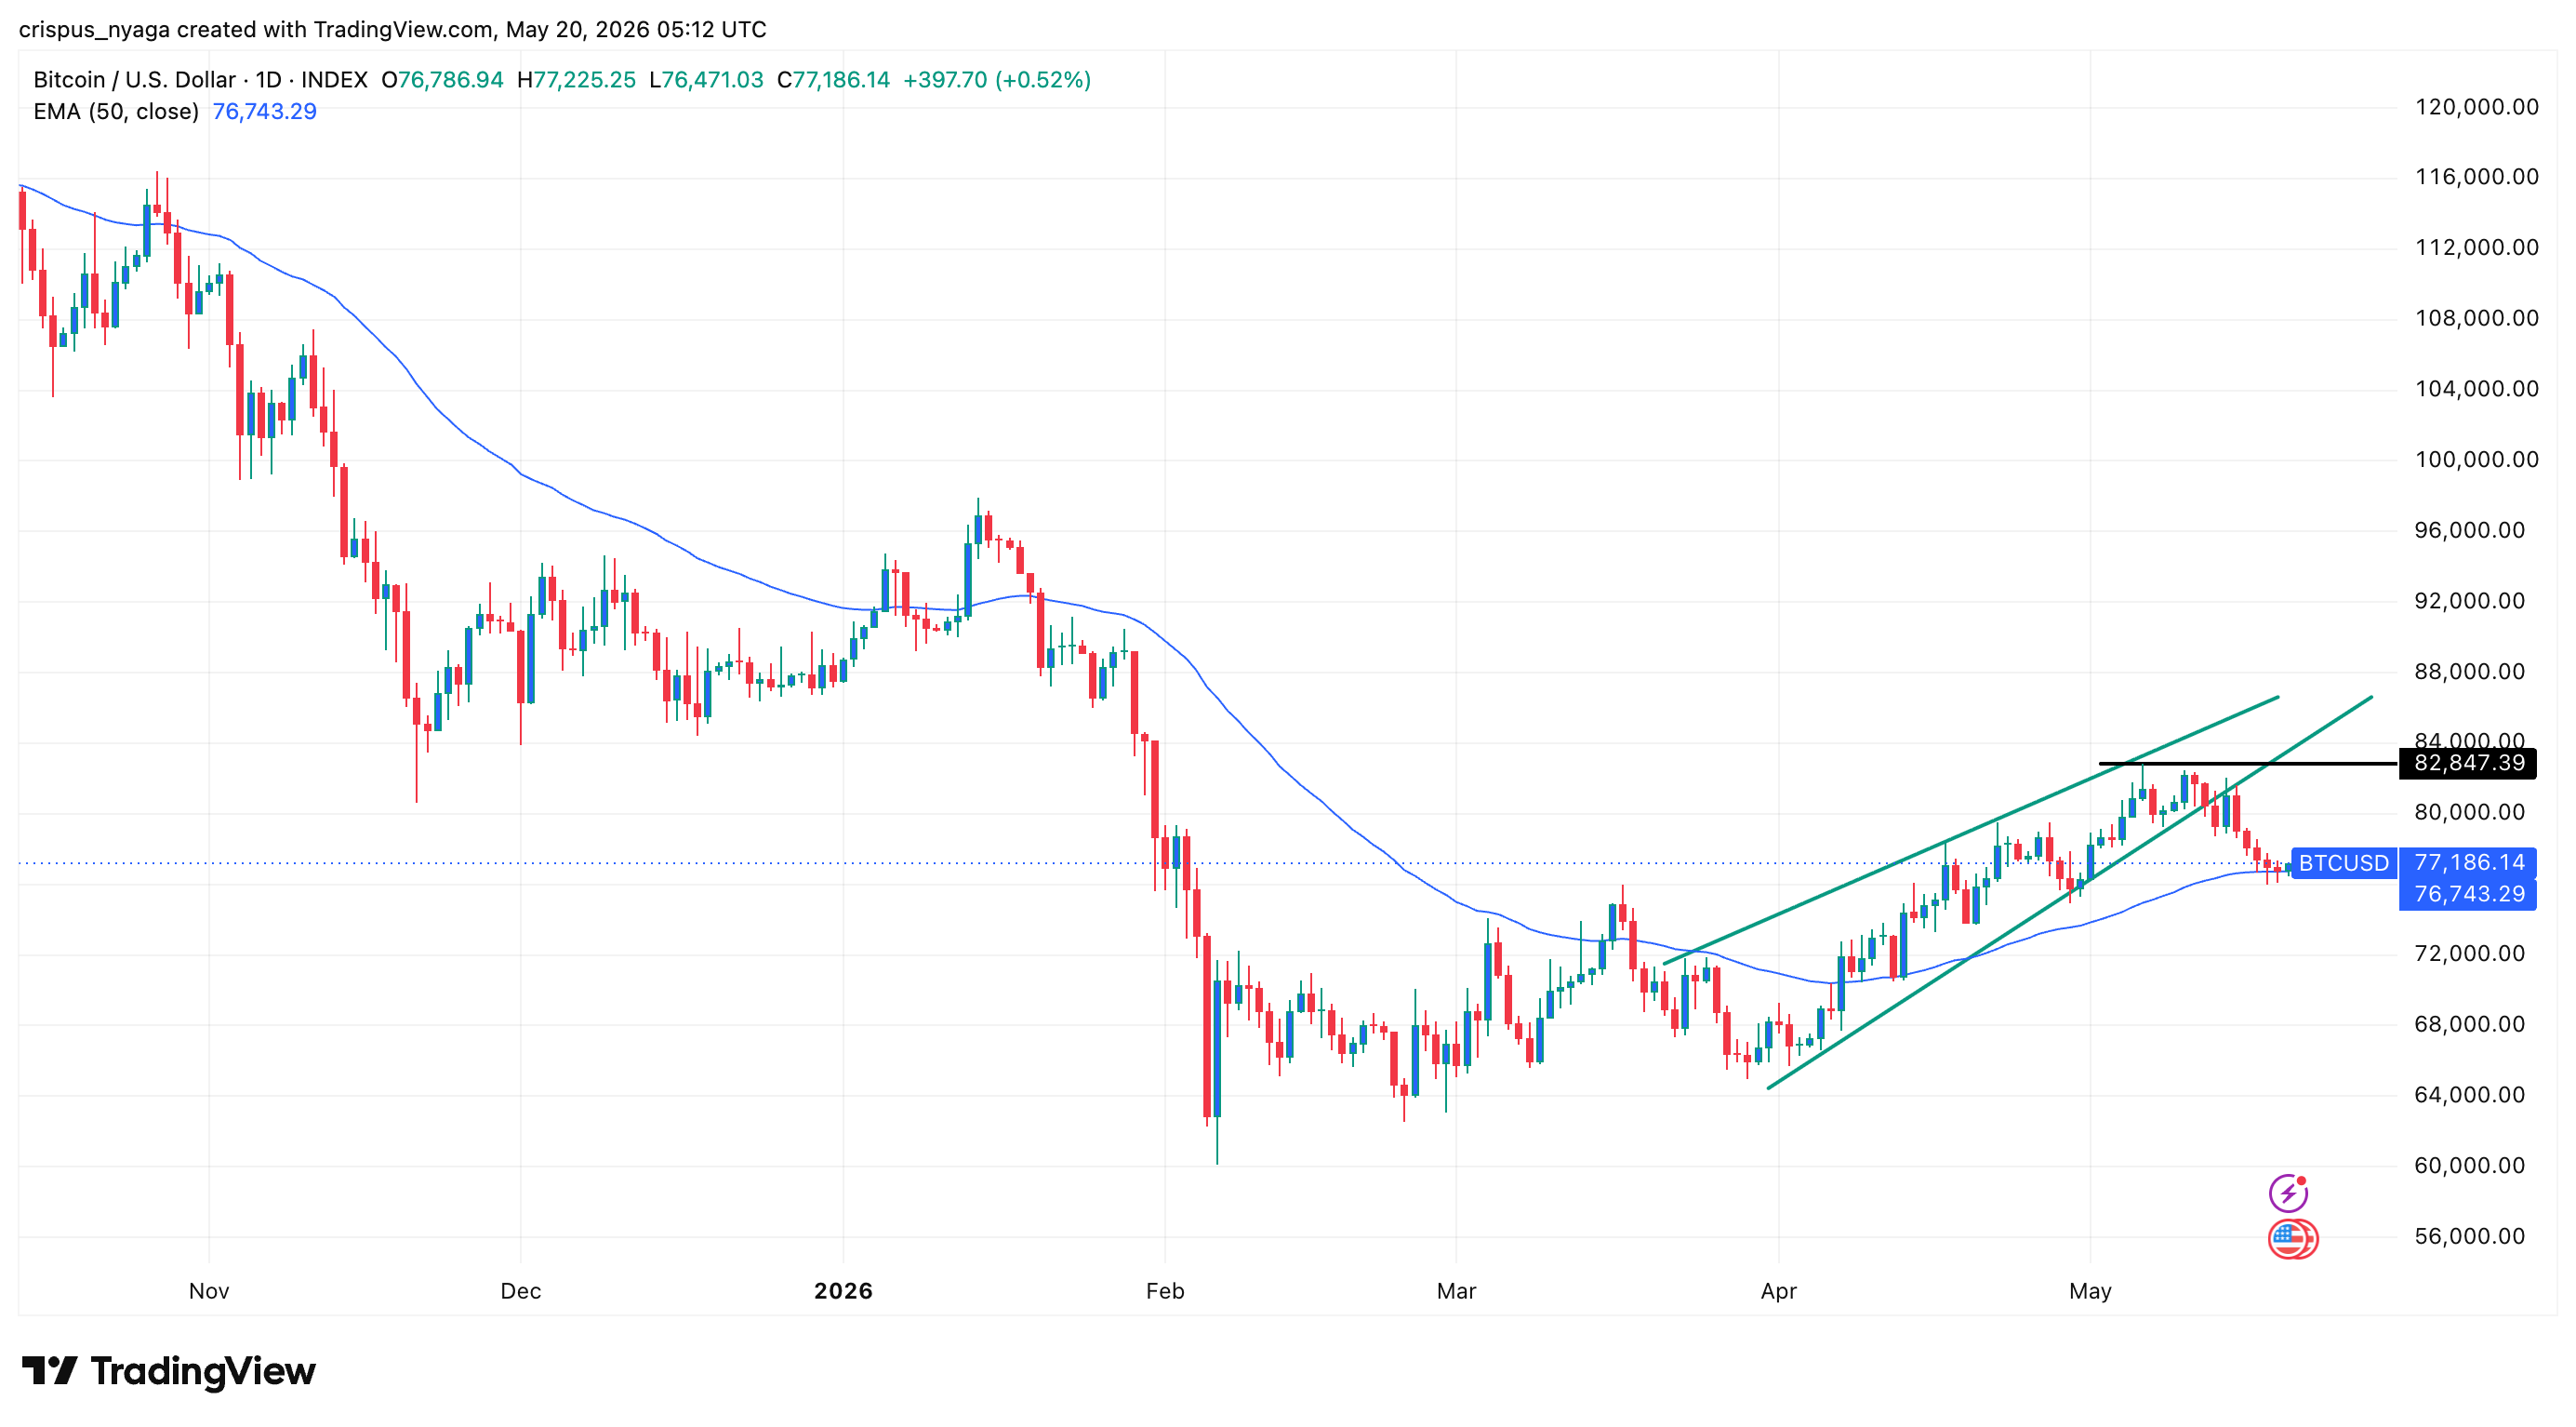
$BTC Price List |Source: TradingView
The technician will also explain why. $BTC Prices have plummeted in the last few days. As the chart above shows, the coin started forming an ascending wedge pattern on March 23rd. This pattern consists of two uptrend lines, and a bearish breakout occurs when they approach their confluence.
The coin has made a bearish breakout and is currently hovering around the 50-day moving average. A decline below this price would confirm a bearish breakout and indicate further downside potential in the short term. If that happens, the next important level to watch will be $70,000.