

summary
- Bitcoin is testing the lower end of the ascending channel near $63,500
- 0.382 Fibonacci retracement overlaps channel support and strengthens that level
- Although the trading volume declined, it remained quiet, but this indicates profit-taking rather than a breakdown.
- Next 4-hour closes on either side of $63,500 will determine short-term trend
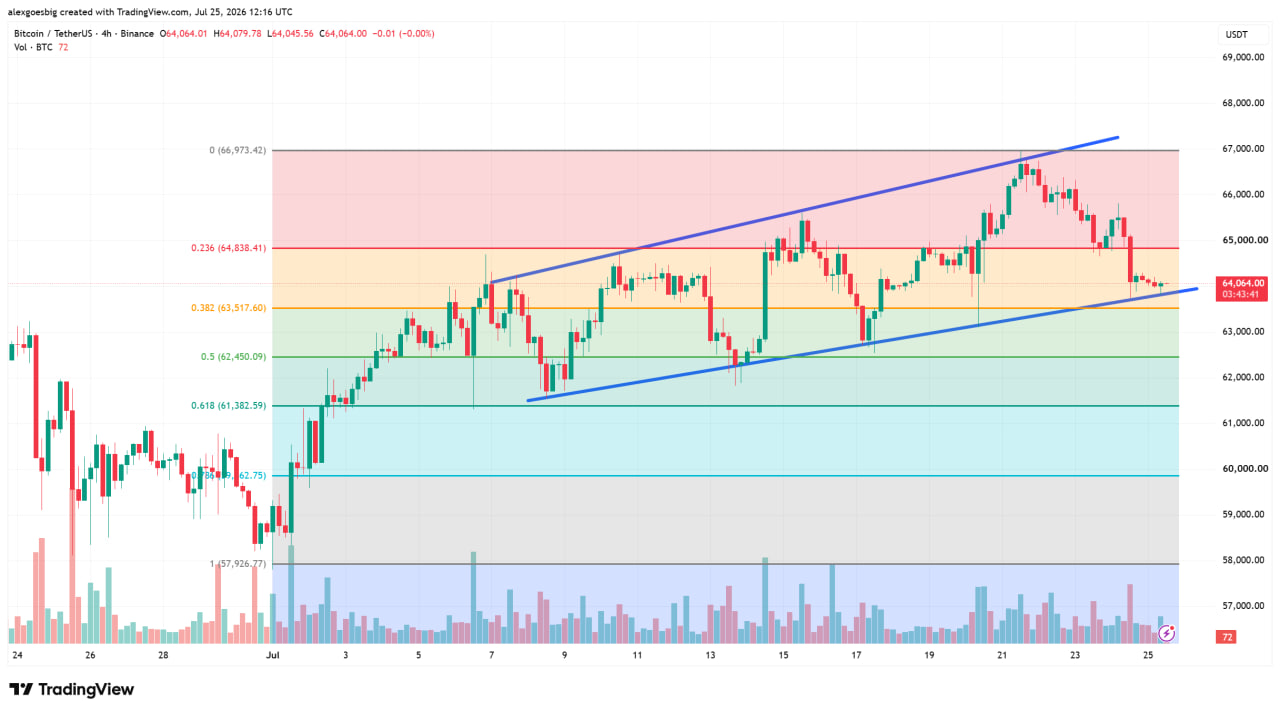
Bitcoin was trading at $64,081 on Binance in the early morning hours of July 25, sitting just above the base of the ascending channel that has formed the rally since early July. After the price stalled at $66,973 on July 21st, a pullback began, taking the market into the bottom third of its channel. What makes the current level notable is the overlap. The lower bound of the ascending channel and the 0.382 Fibonacci retracement both reach around $63,500, which turns the zone into a line between a normal push and a break trend.
Where channels and fibs match one floor
A single support line is easy to lose. It is much more difficult to break two support lines that overlap at the same price, and that is exactly where Bitcoin sits on the 4-hour chart. The lower bound of the channel remains near $63,500, with the 0.382 retracement roughly atop it at $63,517.
The logic behind this duplication is very simple. When two independent levels converge to the same price, traders tend to defend that zone more tightly than either line alone, and failure there carries more weight. A clean 4-hour close below $63,500 would remove the channel and Fibonacci level at once, which is a much sharper bearish signal than either giving way on its own.
0.236 flip to limit rebound
Currently, the price is boxed between the 0.236 retracement of $64,838 overhead and 0.382 below $63,517. On July 24th, a large red candle popped out of the top half of the box, and it has remained around $64,000 ever since. For most of the past week, 0.236 served as a ledge on which price rested. It has since turned to resistance, and this reversal is the reason why the short-term bias remains low. Buyers need to be confident and get $64,838 back before things change, but until that happens, every time they move higher, they hit sellers at the level that once supported them.
The momentum cools down, but the volume remains quiet
The RSI on the 4-hour chart has dropped to 37 on the fast line and its signal is 42.76, both reversals from the highs recorded during the July 21st push. A reading in the mid-$30s, while not reaching the sub-30 zone that indicates an oversold snapback, indicates that selling pressure is building and buyers are loosening up. Here the momentum is weakening rather than reversing. If the price sticks to the $63,500 confluence while RSI is at this low, that combination would have set up a rebound earlier.

It is voluminous and supports calm reading. The fall from the high arrived without a distribution spike, and no surrender candle appeared anywhere on the pullback. A quiet decline in trading volume usually means holders are reducing their positions rather than exiting them in a hurry. It’s worth paying attention to the candlestick’s size as much as its direction, as a break through a voluminous lower limit will quickly reverse its interpretation.
Although he has almost zero capital, he says leverage is not a pressure.
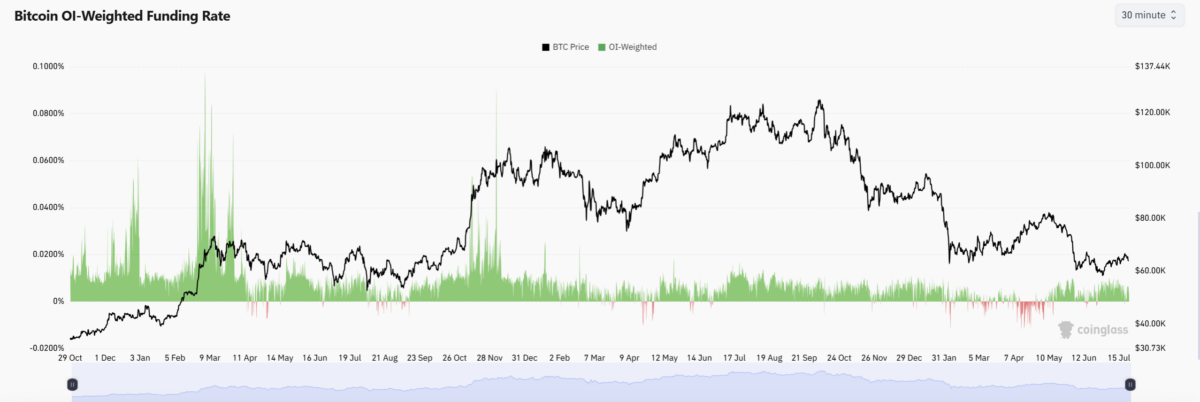
OI weighted funding rate Read 0.0019%is effectively flat. Positive funding means longs are paying shorts to maintain their positions, and high values typically indicate a crowded and overheated market that will rebound violently when the market unwinds. This is just barely clearing the zero line, so Bitcoin maintains the channel even without the leveraged long wall built up behind it. According to CoinGlass datathe liquidation amount in the past day reached $68.21 million, relying on longs. This modest number does not indicate a blowout of leverage and fits the profit-taking story.
What the closing price of the next 4 hours will decide
The chart gives traders a clean binary near $63,500.
If the floor is broken:
- The 0.5 retracement at $62,450 is the first stop and is the dividing line between a healthy decline and a questionable decline.
- Next comes $61,382 at 0.618, the loss of which would jeopardize the entire June-July advance.
If support is enabled:
- The buyer’s first task is to recover 0.236 at $64,838.
- The $65,500 shelf is on it
- A push back to the channel top and a high of $66,973 completes the upward path.
With flat funding and no spike in volume on the way down, there is no leverage story to force the market’s hand, and the decision at $63,500 is based on simple spot demand and supply rather than a forced seller chain. This gives the breakdown from here a different nature than a squeeze-driven flush. Trigger in the opposite direction is fixed to one number. The four-hour close above $64,838 triggered the market to change from a defensive market to a market heading towards the top of the channel once again.


